Native/Alaskan vs Salvadoran Births to Unmarried Women
COMPARE
Native/Alaskan
Salvadoran
Births to Unmarried Women
Births to Unmarried Women Comparison
Natives/Alaskans
Salvadorans
43.0%
BIRTHS TO UNMARRIED WOMEN
0.0/ 100
METRIC RATING
331st/ 347
METRIC RANK
36.0%
BIRTHS TO UNMARRIED WOMEN
0.3/ 100
METRIC RATING
252nd/ 347
METRIC RANK
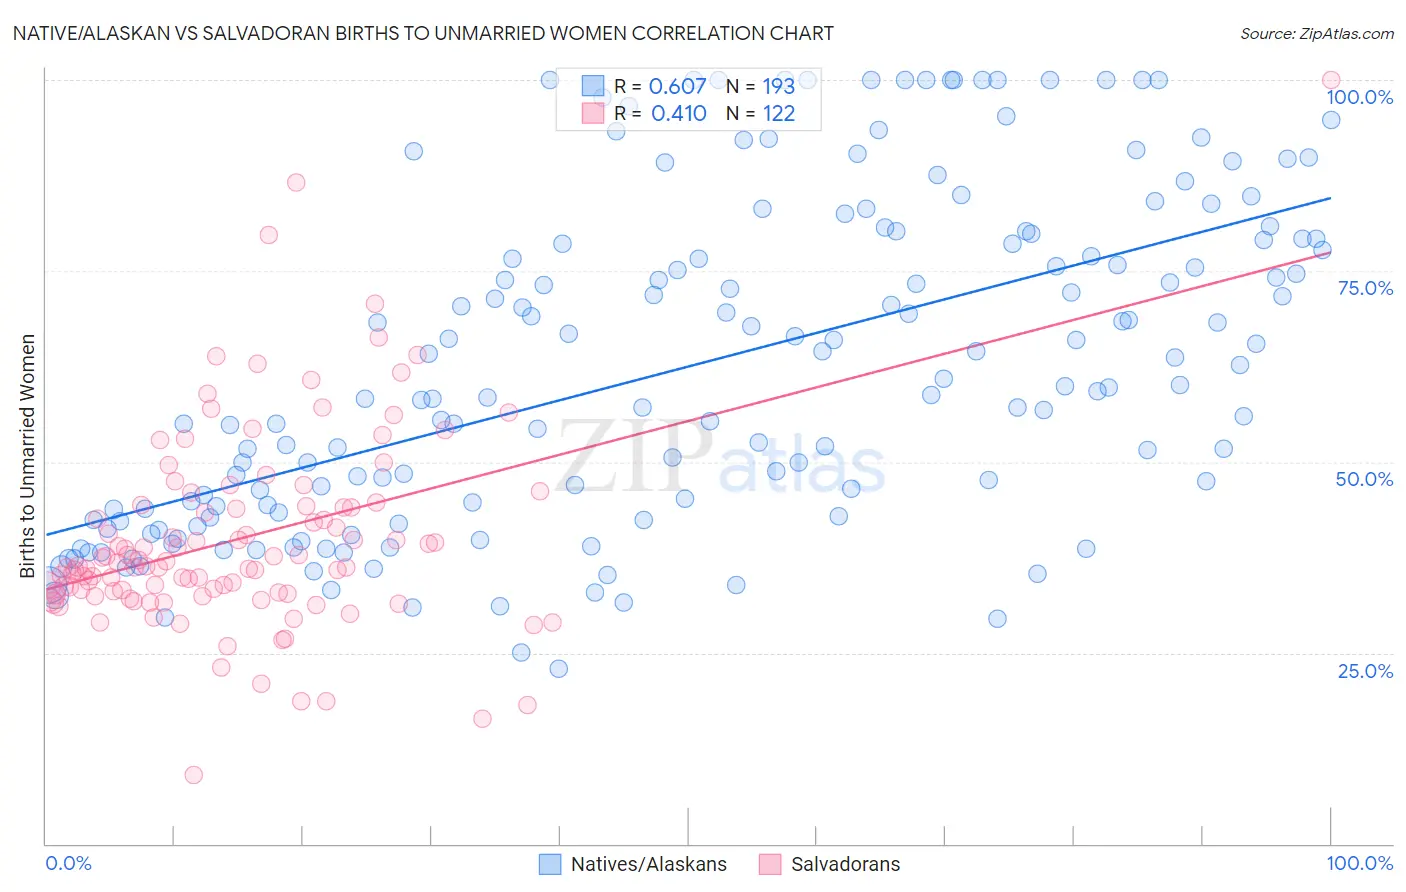
Native/Alaskan vs Salvadoran Births to Unmarried Women Correlation Chart
The statistical analysis conducted on geographies consisting of 471,404,476 people shows a significant positive correlation between the proportion of Natives/Alaskans and percentage of births to unmarried women in the United States with a correlation coefficient (R) of 0.607 and weighted average of 43.0%. Similarly, the statistical analysis conducted on geographies consisting of 377,312,875 people shows a moderate positive correlation between the proportion of Salvadorans and percentage of births to unmarried women in the United States with a correlation coefficient (R) of 0.410 and weighted average of 36.0%, a difference of 19.4%.
Births to Unmarried Women Correlation Summary
| Measurement | Native/Alaskan | Salvadoran |
| Minimum | 22.9% | 9.0% |
| Maximum | 100.0% | 100.0% |
| Range | 77.1% | 91.0% |
| Mean | 62.5% | 40.0% |
| Median | 59.8% | 36.3% |
| Interquartile 25% (IQ1) | 43.2% | 32.7% |
| Interquartile 75% (IQ3) | 79.1% | 44.2% |
| Interquartile Range (IQR) | 35.9% | 11.5% |
| Standard Deviation (Sample) | 21.3% | 13.3% |
| Standard Deviation (Population) | 21.3% | 13.2% |
Similar Demographics by Births to Unmarried Women
Demographics Similar to Natives/Alaskans by Births to Unmarried Women
In terms of births to unmarried women, the demographic groups most similar to Natives/Alaskans are Kiowa (43.1%, a difference of 0.35%), Chippewa (42.6%, a difference of 0.83%), Paiute (42.5%, a difference of 1.2%), Immigrants from Cabo Verde (42.2%, a difference of 1.8%), and Tsimshian (42.2%, a difference of 2.0%).
| Demographics | Rating | Rank | Births to Unmarried Women |
| Cape Verdeans | 0.0 /100 | #324 | Tragic 41.3% |
| Cheyenne | 0.0 /100 | #325 | Tragic 41.3% |
| Immigrants | Cuba | 0.0 /100 | #326 | Tragic 41.5% |
| Tsimshian | 0.0 /100 | #327 | Tragic 42.2% |
| Immigrants | Cabo Verde | 0.0 /100 | #328 | Tragic 42.2% |
| Paiute | 0.0 /100 | #329 | Tragic 42.5% |
| Chippewa | 0.0 /100 | #330 | Tragic 42.6% |
| Natives/Alaskans | 0.0 /100 | #331 | Tragic 43.0% |
| Kiowa | 0.0 /100 | #332 | Tragic 43.1% |
| Blacks/African Americans | 0.0 /100 | #333 | Tragic 44.3% |
| Yuman | 0.0 /100 | #334 | Tragic 44.4% |
| Colville | 0.0 /100 | #335 | Tragic 45.3% |
| Puerto Ricans | 0.0 /100 | #336 | Tragic 45.7% |
| Houma | 0.0 /100 | #337 | Tragic 46.6% |
| Arapaho | 0.0 /100 | #338 | Tragic 47.1% |
Demographics Similar to Salvadorans by Births to Unmarried Women
In terms of births to unmarried women, the demographic groups most similar to Salvadorans are Immigrants from Western Africa (36.0%, a difference of 0.12%), Immigrants from Portugal (36.2%, a difference of 0.46%), Potawatomi (36.2%, a difference of 0.68%), Mexican American Indian (35.7%, a difference of 0.69%), and Chickasaw (36.3%, a difference of 0.82%).
| Demographics | Rating | Rank | Births to Unmarried Women |
| Shoshone | 0.8 /100 | #245 | Tragic 35.3% |
| Nigerians | 0.7 /100 | #246 | Tragic 35.3% |
| Immigrants | Nigeria | 0.7 /100 | #247 | Tragic 35.4% |
| Immigrants | Nonimmigrants | 0.6 /100 | #248 | Tragic 35.5% |
| Bermudans | 0.6 /100 | #249 | Tragic 35.5% |
| Mexican American Indians | 0.4 /100 | #250 | Tragic 35.7% |
| Immigrants | Western Africa | 0.3 /100 | #251 | Tragic 36.0% |
| Salvadorans | 0.3 /100 | #252 | Tragic 36.0% |
| Immigrants | Portugal | 0.2 /100 | #253 | Tragic 36.2% |
| Potawatomi | 0.2 /100 | #254 | Tragic 36.2% |
| Chickasaw | 0.2 /100 | #255 | Tragic 36.3% |
| Immigrants | Trinidad and Tobago | 0.2 /100 | #256 | Tragic 36.3% |
| Immigrants | Grenada | 0.2 /100 | #257 | Tragic 36.3% |
| Americans | 0.2 /100 | #258 | Tragic 36.4% |
| Immigrants | El Salvador | 0.2 /100 | #259 | Tragic 36.4% |