Immigrants from Ethiopia vs Estonian Births to Unmarried Women
COMPARE
Immigrants from Ethiopia
Estonian
Births to Unmarried Women
Births to Unmarried Women Comparison
Immigrants from Ethiopia
Estonians
29.7%
BIRTHS TO UNMARRIED WOMEN
93.4/ 100
METRIC RATING
110th/ 347
METRIC RANK
29.2%
BIRTHS TO UNMARRIED WOMEN
96.5/ 100
METRIC RATING
93rd/ 347
METRIC RANK
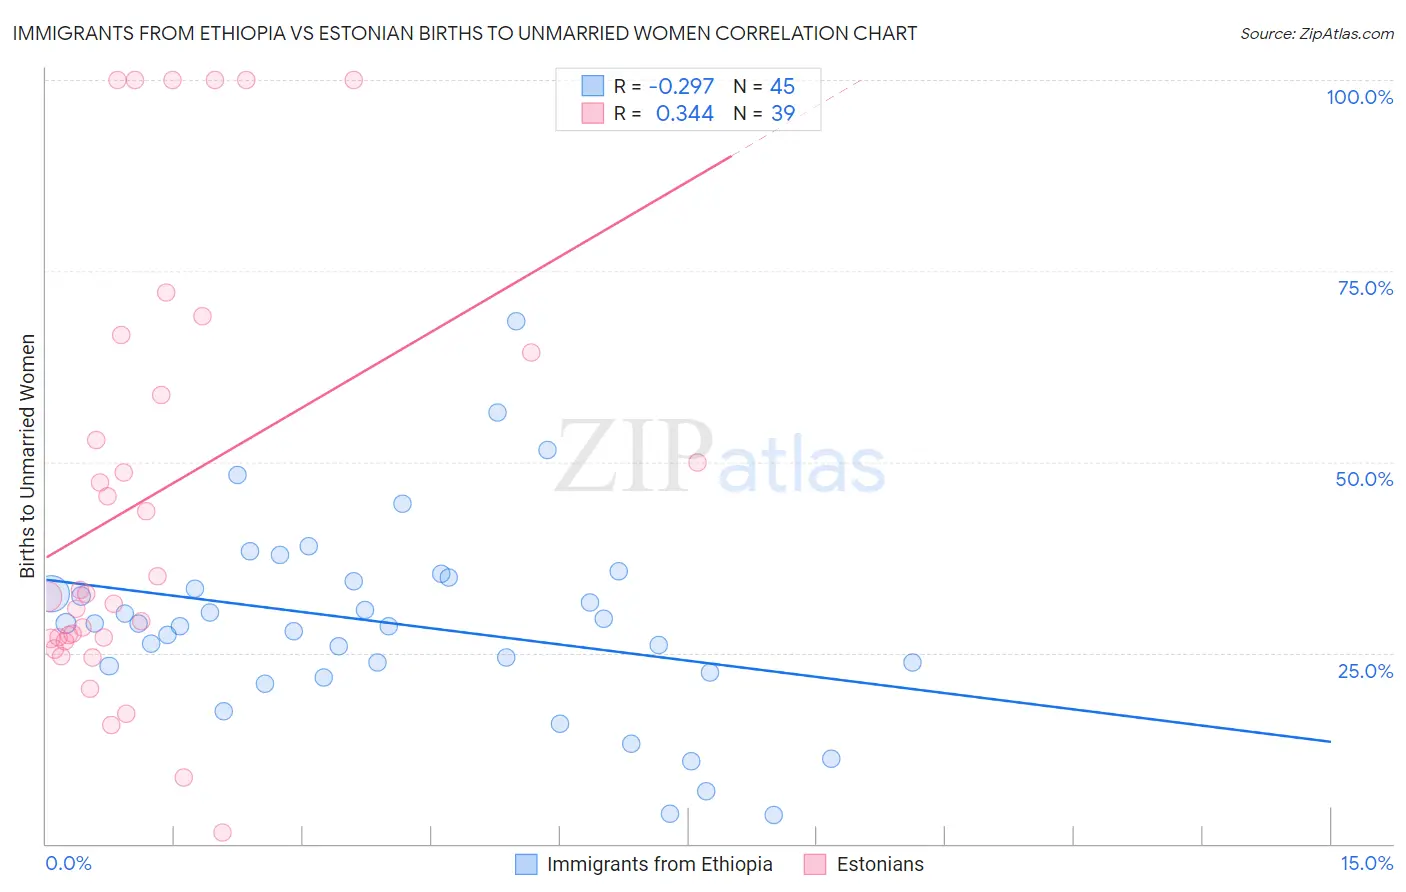
Immigrants from Ethiopia vs Estonian Births to Unmarried Women Correlation Chart
The statistical analysis conducted on geographies consisting of 204,461,037 people shows a weak negative correlation between the proportion of Immigrants from Ethiopia and percentage of births to unmarried women in the United States with a correlation coefficient (R) of -0.297 and weighted average of 29.7%. Similarly, the statistical analysis conducted on geographies consisting of 118,165,296 people shows a mild positive correlation between the proportion of Estonians and percentage of births to unmarried women in the United States with a correlation coefficient (R) of 0.344 and weighted average of 29.2%, a difference of 1.7%.
Births to Unmarried Women Correlation Summary
| Measurement | Immigrants from Ethiopia | Estonian |
| Minimum | 3.7% | 1.4% |
| Maximum | 68.3% | 100.0% |
| Range | 64.6% | 98.6% |
| Mean | 28.8% | 45.4% |
| Median | 28.8% | 32.7% |
| Interquartile 25% (IQ1) | 22.8% | 26.9% |
| Interquartile 75% (IQ3) | 34.7% | 64.3% |
| Interquartile Range (IQR) | 11.8% | 37.4% |
| Standard Deviation (Sample) | 12.8% | 28.4% |
| Standard Deviation (Population) | 12.6% | 28.1% |
Demographics Similar to Immigrants from Ethiopia and Estonians by Births to Unmarried Women
In terms of births to unmarried women, the demographic groups most similar to Immigrants from Ethiopia are Greek (29.7%, a difference of 0.030%), Paraguayan (29.7%, a difference of 0.070%), Immigrants from Hungary (29.7%, a difference of 0.14%), Immigrants from Brazil (29.6%, a difference of 0.15%), and Swedish (29.6%, a difference of 0.17%). Similarly, the demographic groups most similar to Estonians are Arab (29.2%, a difference of 0.040%), Immigrants from Fiji (29.2%, a difference of 0.080%), Ukrainian (29.2%, a difference of 0.12%), Immigrants from Vietnam (29.3%, a difference of 0.26%), and Norwegian (29.3%, a difference of 0.48%).
| Demographics | Rating | Rank | Births to Unmarried Women |
| Immigrants | Fiji | 96.6 /100 | #91 | Exceptional 29.2% |
| Arabs | 96.5 /100 | #92 | Exceptional 29.2% |
| Estonians | 96.5 /100 | #93 | Exceptional 29.2% |
| Ukrainians | 96.3 /100 | #94 | Exceptional 29.2% |
| Immigrants | Vietnam | 96.1 /100 | #95 | Exceptional 29.3% |
| Norwegians | 95.8 /100 | #96 | Exceptional 29.3% |
| Immigrants | South Africa | 95.7 /100 | #97 | Exceptional 29.3% |
| Immigrants | Syria | 95.7 /100 | #98 | Exceptional 29.4% |
| Immigrants | Denmark | 95.3 /100 | #99 | Exceptional 29.4% |
| Luxembourgers | 95.2 /100 | #100 | Exceptional 29.4% |
| Immigrants | Northern Africa | 94.7 /100 | #101 | Exceptional 29.5% |
| Australians | 94.6 /100 | #102 | Exceptional 29.5% |
| Lebanese | 94.4 /100 | #103 | Exceptional 29.5% |
| Lithuanians | 94.4 /100 | #104 | Exceptional 29.6% |
| Immigrants | Nepal | 94.3 /100 | #105 | Exceptional 29.6% |
| Swedes | 93.8 /100 | #106 | Exceptional 29.6% |
| Immigrants | Brazil | 93.7 /100 | #107 | Exceptional 29.6% |
| Paraguayans | 93.5 /100 | #108 | Exceptional 29.7% |
| Greeks | 93.4 /100 | #109 | Exceptional 29.7% |
| Immigrants | Ethiopia | 93.4 /100 | #110 | Exceptional 29.7% |
| Immigrants | Hungary | 93.0 /100 | #111 | Exceptional 29.7% |