Native/Alaskan vs Chinese Single Mother Households
COMPARE
Native/Alaskan
Chinese
Single Mother Households
Single Mother Households Comparison
Natives/Alaskans
Chinese
8.0%
SINGLE MOTHER HOUSEHOLDS
0.0/ 100
METRIC RATING
304th/ 347
METRIC RANK
5.2%
SINGLE MOTHER HOUSEHOLDS
99.9/ 100
METRIC RATING
19th/ 347
METRIC RANK
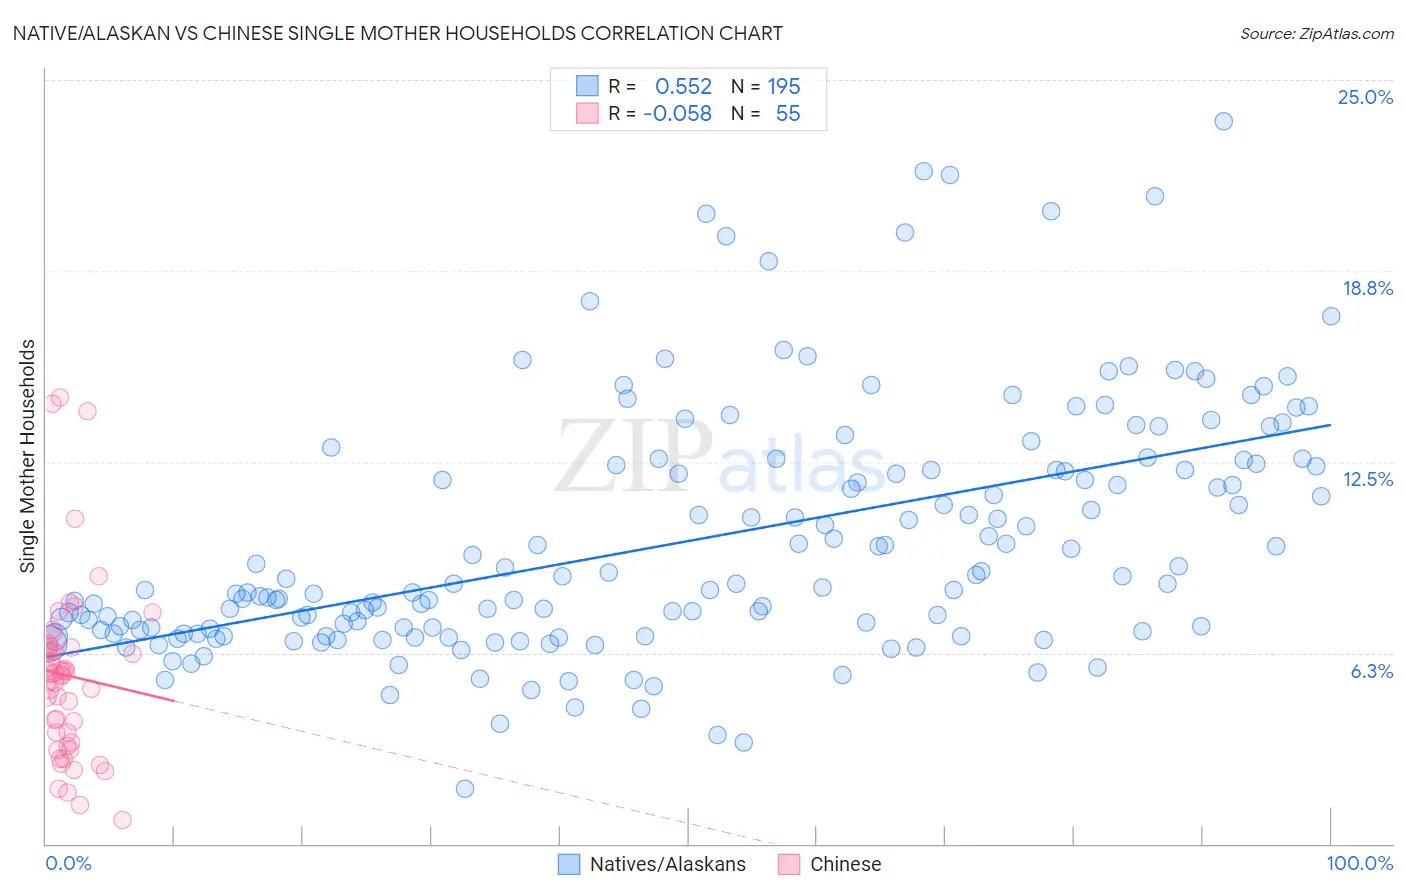
Native/Alaskan vs Chinese Single Mother Households Correlation Chart
The statistical analysis conducted on geographies consisting of 510,596,383 people shows a substantial positive correlation between the proportion of Natives/Alaskans and percentage of single mother households in the United States with a correlation coefficient (R) of 0.552 and weighted average of 8.0%. Similarly, the statistical analysis conducted on geographies consisting of 64,782,861 people shows a slight negative correlation between the proportion of Chinese and percentage of single mother households in the United States with a correlation coefficient (R) of -0.058 and weighted average of 5.2%, a difference of 55.4%.
Single Mother Households Correlation Summary
| Measurement | Native/Alaskan | Chinese |
| Minimum | 1.8% | 0.78% |
| Maximum | 23.6% | 14.6% |
| Range | 21.8% | 13.8% |
| Mean | 9.9% | 5.5% |
| Median | 8.4% | 5.5% |
| Interquartile 25% (IQ1) | 7.0% | 3.3% |
| Interquartile 75% (IQ3) | 12.4% | 6.4% |
| Interquartile Range (IQR) | 5.4% | 3.1% |
| Standard Deviation (Sample) | 4.0% | 2.9% |
| Standard Deviation (Population) | 4.0% | 2.9% |
Similar Demographics by Single Mother Households
Demographics Similar to Natives/Alaskans by Single Mother Households
In terms of single mother households, the demographic groups most similar to Natives/Alaskans are Colville (8.0%, a difference of 0.050%), Immigrants from Barbados (8.0%, a difference of 0.12%), Immigrants from St. Vincent and the Grenadines (8.0%, a difference of 0.36%), Immigrants from Central America (8.1%, a difference of 0.38%), and Immigrants from Bahamas (8.0%, a difference of 0.44%).
| Demographics | Rating | Rank | Single Mother Households |
| Hispanics or Latinos | 0.0 /100 | #297 | Tragic 7.9% |
| Immigrants | West Indies | 0.0 /100 | #298 | Tragic 7.9% |
| Houma | 0.0 /100 | #299 | Tragic 7.9% |
| Mexicans | 0.0 /100 | #300 | Tragic 8.0% |
| Chippewa | 0.0 /100 | #301 | Tragic 8.0% |
| Immigrants | Ghana | 0.0 /100 | #302 | Tragic 8.0% |
| Immigrants | Bahamas | 0.0 /100 | #303 | Tragic 8.0% |
| Natives/Alaskans | 0.0 /100 | #304 | Tragic 8.0% |
| Colville | 0.0 /100 | #305 | Tragic 8.0% |
| Immigrants | Barbados | 0.0 /100 | #306 | Tragic 8.0% |
| Immigrants | St. Vincent and the Grenadines | 0.0 /100 | #307 | Tragic 8.0% |
| Immigrants | Central America | 0.0 /100 | #308 | Tragic 8.1% |
| Cheyenne | 0.0 /100 | #309 | Tragic 8.1% |
| Hondurans | 0.0 /100 | #310 | Tragic 8.1% |
| Immigrants | Congo | 0.0 /100 | #311 | Tragic 8.1% |
Demographics Similar to Chinese by Single Mother Households
In terms of single mother households, the demographic groups most similar to Chinese are Immigrants from Armenia (5.2%, a difference of 0.11%), Maltese (5.2%, a difference of 0.47%), Eastern European (5.2%, a difference of 0.53%), Soviet Union (5.1%, a difference of 0.88%), and Indian (Asian) (5.1%, a difference of 1.1%).
| Demographics | Rating | Rank | Single Mother Households |
| Cypriots | 99.9 /100 | #12 | Exceptional 5.1% |
| Immigrants | India | 99.9 /100 | #13 | Exceptional 5.1% |
| Immigrants | Australia | 99.9 /100 | #14 | Exceptional 5.1% |
| Immigrants | Eastern Asia | 99.9 /100 | #15 | Exceptional 5.1% |
| Indians (Asian) | 99.9 /100 | #16 | Exceptional 5.1% |
| Soviet Union | 99.9 /100 | #17 | Exceptional 5.1% |
| Immigrants | Armenia | 99.9 /100 | #18 | Exceptional 5.2% |
| Chinese | 99.9 /100 | #19 | Exceptional 5.2% |
| Maltese | 99.9 /100 | #20 | Exceptional 5.2% |
| Eastern Europeans | 99.8 /100 | #21 | Exceptional 5.2% |
| Thais | 99.8 /100 | #22 | Exceptional 5.2% |
| Immigrants | Austria | 99.8 /100 | #23 | Exceptional 5.2% |
| Armenians | 99.8 /100 | #24 | Exceptional 5.2% |
| Immigrants | Japan | 99.8 /100 | #25 | Exceptional 5.2% |
| Immigrants | Lithuania | 99.8 /100 | #26 | Exceptional 5.3% |