Czechoslovakian vs Chinese Single Mother Households

COMPARE

Czechoslovakian
Race
Ancestry
AfghanAfricanAlaska NativeAlaskan AthabascanAlbanianAleutAlsatianAmericanApacheArabArapahoArgentineanArmenianAssyrian/Chaldean/SyriacAustralianAustrianBahamianBangladeshiBarbadianBasqueBelgianBelizeanBermudanBhutaneseBlackfeetBolivianBrazilianBritishBritish West IndianBulgarianBurmeseCajunCambodianCanadianCape VerdeanCarpatho RusynCelticCentral AmericanCentral American IndianCherokeeCheyenneChickasawChileanChippewaChoctawColombianColvilleComancheCosta RicanCreeCreekCroatianCrowCubanCypriotCzechCzechoslovakianDanishDelawareDominicanDutchDutch West IndianEastern EuropeanEcuadorianEgyptianEnglishEstonianEthiopianEuropeanFijianFilipinoFinnishFrenchFrench American IndianFrench CanadianGermanGerman RussianGhanaianGreekGuamanian/ChamorroGuatemalanGuyaneseHaitianHmongHonduranHopiHoumaHungarianIcelanderIndian (Asian)IndonesianInupiatIranianIraqiIrishIroquoisIsraeliItalianJamaicanJapaneseJordanianKenyanKiowaKoreanLaotianLatvianLebaneseLiberianLithuanianLumbeeLuxembourgerMacedonianMalaysianMalteseMarshalleseMenomineeMexicanMexican American IndianMongolianMoroccanNative HawaiianNavajoNepaleseNew ZealanderNicaraguanNigerianNorthern EuropeanNorwegianOkinawanOsageOttawaPaiutePakistaniPalestinianPanamanianParaguayanPennsylvania GermanPeruvianPimaPolishPortuguesePotawatomiPuebloPuerto RicanPuget Sound SalishRomanianRussianSalvadoranSamoanScandinavianScotch-IrishScottishSeminoleSenegaleseSerbianShoshoneSierra LeoneanSiouxSlavicSlovakSloveneSomaliSouth AfricanSouth AmericanSouth American IndianSoviet UnionSpaniardSpanishSpanish AmericanSpanish American IndianSri LankanSubsaharan AfricanSudaneseSwedishSwissSyrianTaiwaneseThaiTlingit-HaidaTohono O'OdhamTonganTrinidadian and TobagonianTsimshianTurkishU.S. Virgin IslanderUgandanUkrainianUruguayanUteVenezuelanVietnameseWelshWest IndianYakamaYaquiYugoslavianYumanYup'ikZimbabwean
Immigration
NonimmigrantsImmigrantsAfghanistanAfricaAlbaniaArgentinaArmeniaAsiaAustraliaAustriaBahamasBangladeshBarbadosBelarusBelgiumBelizeBoliviaBosnia and HerzegovinaBrazilBulgariaBurma/MyanmarCabo VerdeCambodiaCameroonCanadaCaribbeanCentral AmericaChileChinaColombiaCongoCosta RicaCroatiaCubaCzechoslovakiaDenmarkDominicaDominican RepublicEastern AfricaEastern AsiaEastern EuropeEcuadorEgyptEl SalvadorEnglandEritreaEthiopiaEuropeFijiFranceGermanyGhanaGreeceGrenadaGuatemalaGuyanaHaitiHondurasHong KongHungaryIndiaIndonesiaIranIraqIrelandIsraelItalyJamaicaJapanJordanKazakhstanKenyaKoreaKuwaitLaosLatin AmericaLatviaLebanonLiberiaLithuaniaMalaysiaMexicoMicronesiaMiddle AfricaMoldovaMoroccoNepalNetherlandsNicaraguaNigeriaNorth AmericaNorth MacedoniaNorthern AfricaNorthern EuropeNorwayOceaniaPakistanPanamaPeruPhilippinesPolandPortugalRomaniaRussiaSaudi ArabiaScotlandSenegalSerbiaSierra LeoneSingaporeSomaliaSouth AfricaSouth AmericaSouth Central AsiaSouth Eastern AsiaSouthern EuropeSpainSri LankaSt. Vincent and the GrenadinesSudanSwedenSwitzerlandSyriaTaiwanThailandTrinidad and TobagoTurkeyUgandaUkraineUruguayUzbekistanVenezuelaVietnamWest IndiesWestern AfricaWestern AsiaWestern EuropeYemenZaireZimbabweAzores
Chinese
Race
Ancestry
AfghanAfricanAlaska NativeAlaskan AthabascanAlbanianAleutAlsatianAmericanApacheArabArapahoArgentineanArmenianAssyrian/Chaldean/SyriacAustralianAustrianBahamianBangladeshiBarbadianBasqueBelgianBelizeanBermudanBhutaneseBlackfeetBolivianBrazilianBritishBritish West IndianBulgarianBurmeseCajunCambodianCanadianCape VerdeanCarpatho RusynCelticCentral AmericanCentral American IndianCherokeeCheyenneChickasawChileanChineseChippewaChoctawColombianColvilleComancheCosta RicanCreeCreekCroatianCrowCubanCypriotCzechDanishDelawareDominicanDutchDutch West IndianEastern EuropeanEcuadorianEgyptianEnglishEstonianEthiopianEuropeanFijianFilipinoFinnishFrenchFrench American IndianFrench CanadianGermanGerman RussianGhanaianGreekGuamanian/ChamorroGuatemalanGuyaneseHaitianHmongHonduranHopiHoumaHungarianIcelanderIndian (Asian)IndonesianInupiatIranianIraqiIrishIroquoisIsraeliItalianJamaicanJapaneseJordanianKenyanKiowaKoreanLaotianLatvianLebaneseLiberianLithuanianLumbeeLuxembourgerMacedonianMalaysianMalteseMarshalleseMenomineeMexicanMexican American IndianMongolianMoroccanNative HawaiianNavajoNepaleseNew ZealanderNicaraguanNigerianNorthern EuropeanNorwegianOkinawanOsageOttawaPaiutePakistaniPalestinianPanamanianParaguayanPennsylvania GermanPeruvianPimaPolishPortuguesePotawatomiPuebloPuerto RicanPuget Sound SalishRomanianRussianSalvadoranSamoanScandinavianScotch-IrishScottishSeminoleSenegaleseSerbianShoshoneSierra LeoneanSiouxSlavicSlovakSloveneSomaliSouth AfricanSouth AmericanSouth American IndianSoviet UnionSpaniardSpanishSpanish AmericanSpanish American IndianSri LankanSubsaharan AfricanSudaneseSwedishSwissSyrianTaiwaneseThaiTlingit-HaidaTohono O'OdhamTonganTrinidadian and TobagonianTsimshianTurkishU.S. Virgin IslanderUgandanUkrainianUruguayanUteVenezuelanVietnameseWelshWest IndianYakamaYaquiYugoslavianYumanYup'ikZimbabwean
Immigration
NonimmigrantsImmigrantsAfghanistanAfricaAlbaniaArgentinaArmeniaAsiaAustraliaAustriaBahamasBangladeshBarbadosBelarusBelgiumBelizeBoliviaBosnia and HerzegovinaBrazilBulgariaBurma/MyanmarCabo VerdeCambodiaCameroonCanadaCaribbeanCentral AmericaChileChinaColombiaCongoCosta RicaCroatiaCubaCzechoslovakiaDenmarkDominicaDominican RepublicEastern AfricaEastern AsiaEastern EuropeEcuadorEgyptEl SalvadorEnglandEritreaEthiopiaEuropeFijiFranceGermanyGhanaGreeceGrenadaGuatemalaGuyanaHaitiHondurasHong KongHungaryIndiaIndonesiaIranIraqIrelandIsraelItalyJamaicaJapanJordanKazakhstanKenyaKoreaKuwaitLaosLatin AmericaLatviaLebanonLiberiaLithuaniaMalaysiaMexicoMicronesiaMiddle AfricaMoldovaMoroccoNepalNetherlandsNicaraguaNigeriaNorth AmericaNorth MacedoniaNorthern AfricaNorthern EuropeNorwayOceaniaPakistanPanamaPeruPhilippinesPolandPortugalRomaniaRussiaSaudi ArabiaScotlandSenegalSerbiaSierra LeoneSingaporeSomaliaSouth AfricaSouth AmericaSouth Central AsiaSouth Eastern AsiaSouthern EuropeSpainSri LankaSt. Vincent and the GrenadinesSudanSwedenSwitzerlandSyriaTaiwanThailandTrinidad and TobagoTurkeyUgandaUkraineUruguayUzbekistanVenezuelaVietnamWest IndiesWestern AfricaWestern AsiaWestern EuropeYemenZaireZimbabweAzores
Single Mother Households
Income
Poverty
Unemployment
Labor Participation
Family Structure
Vehicle Availability
Education Level
Disability

Single Mother Households Comparison

Czechoslovakians

Chinese

Exceptional
Exceptional
5.9%
SINGLE MOTHER HOUSEHOLDS
92.2/ 100
METRIC RATING
128th/ 347
METRIC RANK
5.2%
SINGLE MOTHER HOUSEHOLDS
99.9/ 100
METRIC RATING
19th/ 347
METRIC RANK

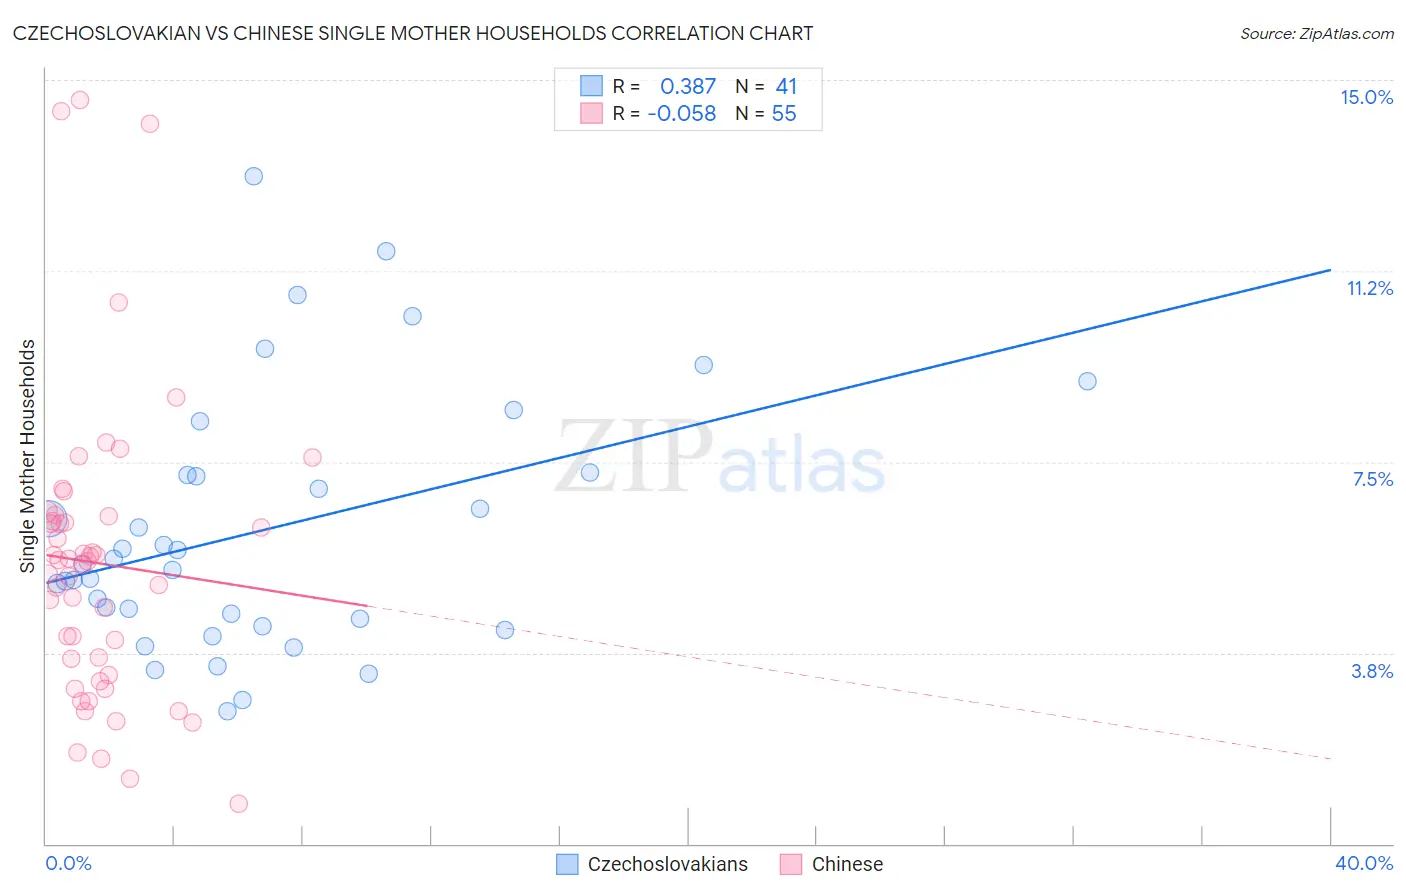
Czechoslovakian vs Chinese Single Mother Households Correlation Chart

The statistical analysis conducted on geographies consisting of 367,454,114 people shows a mild positive correlation between the proportion of Czechoslovakians and percentage of single mother households in the United States with a correlation coefficient (R) of 0.387 and weighted average of 5.9%. Similarly, the statistical analysis conducted on geographies consisting of 64,782,861 people shows a slight negative correlation between the proportion of Chinese and percentage of single mother households in the United States with a correlation coefficient (R) of -0.058 and weighted average of 5.2%, a difference of 14.0%.
Czechoslovakian vs Chinese Single Mother Households

Single Mother Households Correlation Summary

MeasurementCzechoslovakianChinese
Minimum2.6%0.78%
Maximum13.1%14.6%
Range10.5%13.8%
Mean6.2%5.5%
Median5.5%5.5%
Interquartile 25% (IQ1)4.3%3.3%
Interquartile 75% (IQ3)7.3%6.4%
Interquartile Range (IQR)2.9%3.1%
Standard Deviation (Sample)2.5%2.9%
Standard Deviation (Population)2.5%2.9%

Similar Demographics by Single Mother Households

Demographics Similar to Czechoslovakians by Single Mother Households

In terms of single mother households, the demographic groups most similar to Czechoslovakians are Immigrants from Bolivia (5.9%, a difference of 0.010%), Palestinian (5.9%, a difference of 0.040%), Lebanese (5.9%, a difference of 0.080%), Welsh (5.9%, a difference of 0.27%), and Slavic (5.9%, a difference of 0.29%).
DemographicsRating | RankSingle Mother Households
Argentineans
93.7
/100
|
#121
Exceptional
5.8%
Belgians
93.5
/100
|
#122
Exceptional
5.8%
Immigrants | Uzbekistan
93.4
/100
|
#123
Exceptional
5.9%
Immigrants | Argentina
93.2
/100
|
#124
Exceptional
5.9%
Slavs
92.9
/100
|
#125
Exceptional
5.9%
Welsh
92.8
/100
|
#126
Exceptional
5.9%
Lebanese
92.4
/100
|
#127
Exceptional
5.9%
Czechoslovakians
92.2
/100
|
#128
Exceptional
5.9%
Immigrants | Bolivia
92.2
/100
|
#129
Exceptional
5.9%
Palestinians
92.1
/100
|
#130
Exceptional
5.9%
Immigrants | Spain
91.2
/100
|
#131
Exceptional
5.9%
Albanians
91.1
/100
|
#132
Exceptional
5.9%
Egyptians
90.7
/100
|
#133
Exceptional
5.9%
Canadians
90.5
/100
|
#134
Exceptional
5.9%
Immigrants | Saudi Arabia
90.2
/100
|
#135
Exceptional
5.9%

Demographics Similar to Chinese by Single Mother Households

In terms of single mother households, the demographic groups most similar to Chinese are Immigrants from Armenia (5.2%, a difference of 0.11%), Maltese (5.2%, a difference of 0.47%), Eastern European (5.2%, a difference of 0.53%), Soviet Union (5.1%, a difference of 0.88%), and Indian (Asian) (5.1%, a difference of 1.1%).
DemographicsRating | RankSingle Mother Households
Cypriots
99.9
/100
|
#12
Exceptional
5.1%
Immigrants | India
99.9
/100
|
#13
Exceptional
5.1%
Immigrants | Australia
99.9
/100
|
#14
Exceptional
5.1%
Immigrants | Eastern Asia
99.9
/100
|
#15
Exceptional
5.1%
Indians (Asian)
99.9
/100
|
#16
Exceptional
5.1%
Soviet Union
99.9
/100
|
#17
Exceptional
5.1%
Immigrants | Armenia
99.9
/100
|
#18
Exceptional
5.2%
Chinese
99.9
/100
|
#19
Exceptional
5.2%
Maltese
99.9
/100
|
#20
Exceptional
5.2%
Eastern Europeans
99.8
/100
|
#21
Exceptional
5.2%
Thais
99.8
/100
|
#22
Exceptional
5.2%
Immigrants | Austria
99.8
/100
|
#23
Exceptional
5.2%
Armenians
99.8
/100
|
#24
Exceptional
5.2%
Immigrants | Japan
99.8
/100
|
#25
Exceptional
5.2%
Immigrants | Lithuania
99.8
/100
|
#26
Exceptional
5.3%