Native/Alaskan vs Immigrants from Western Africa Single Mother Households
COMPARE
Native/Alaskan
Immigrants from Western Africa
Single Mother Households
Single Mother Households Comparison
Natives/Alaskans
Immigrants from Western Africa
8.0%
SINGLE MOTHER HOUSEHOLDS
0.0/ 100
METRIC RATING
304th/ 347
METRIC RANK
8.2%
SINGLE MOTHER HOUSEHOLDS
0.0/ 100
METRIC RATING
315th/ 347
METRIC RANK
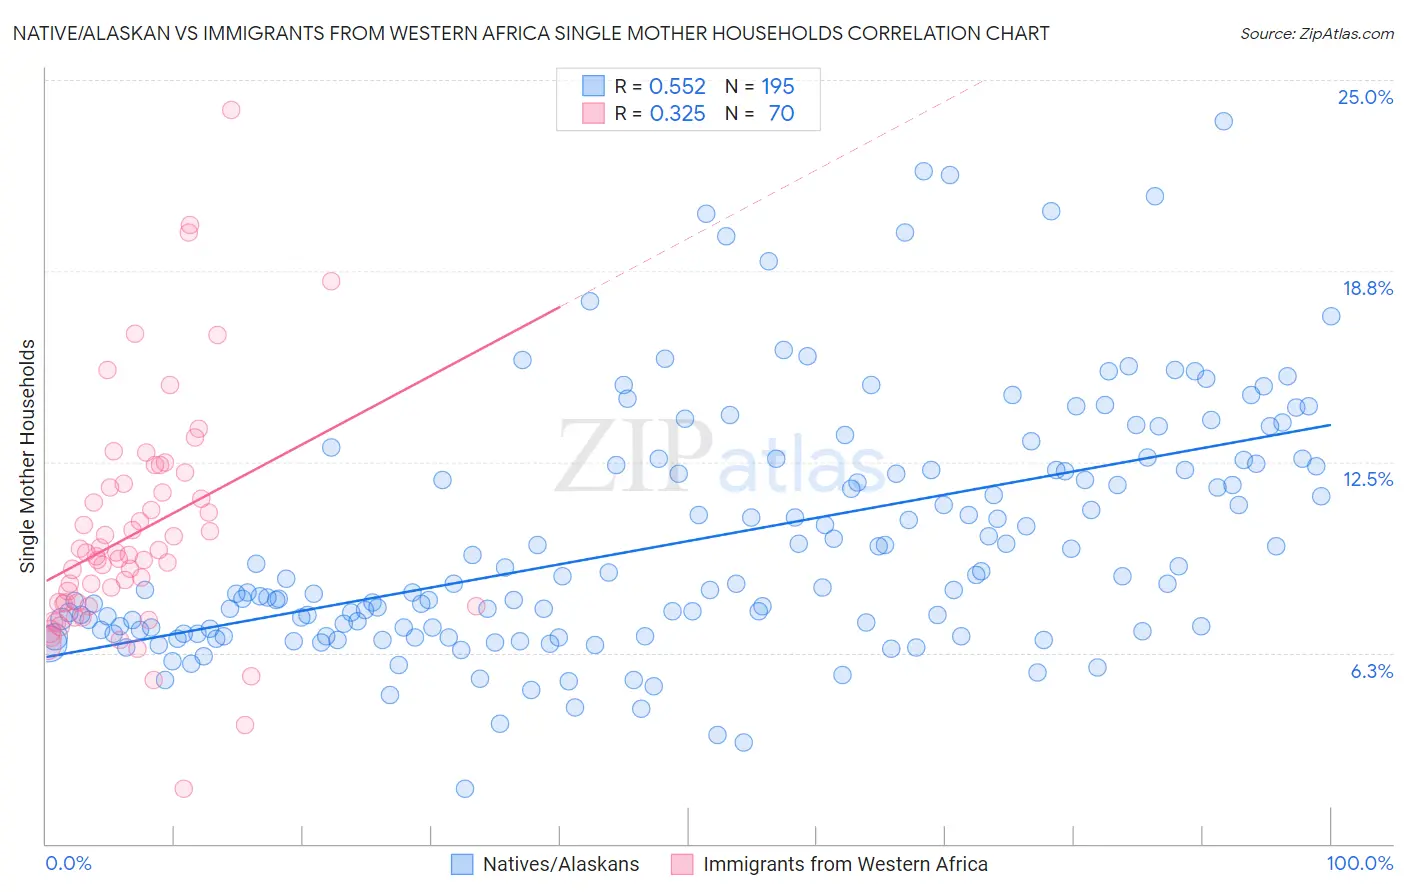
Native/Alaskan vs Immigrants from Western Africa Single Mother Households Correlation Chart
The statistical analysis conducted on geographies consisting of 510,596,383 people shows a substantial positive correlation between the proportion of Natives/Alaskans and percentage of single mother households in the United States with a correlation coefficient (R) of 0.552 and weighted average of 8.0%. Similarly, the statistical analysis conducted on geographies consisting of 357,161,566 people shows a mild positive correlation between the proportion of Immigrants from Western Africa and percentage of single mother households in the United States with a correlation coefficient (R) of 0.325 and weighted average of 8.2%, a difference of 1.8%.
Single Mother Households Correlation Summary
| Measurement | Native/Alaskan | Immigrants from Western Africa |
| Minimum | 1.8% | 1.8% |
| Maximum | 23.6% | 24.0% |
| Range | 21.8% | 22.2% |
| Mean | 9.9% | 10.2% |
| Median | 8.4% | 9.4% |
| Interquartile 25% (IQ1) | 7.0% | 7.9% |
| Interquartile 75% (IQ3) | 12.4% | 11.7% |
| Interquartile Range (IQR) | 5.4% | 3.8% |
| Standard Deviation (Sample) | 4.0% | 3.8% |
| Standard Deviation (Population) | 4.0% | 3.7% |
Demographics Similar to Natives/Alaskans and Immigrants from Western Africa by Single Mother Households
In terms of single mother households, the demographic groups most similar to Natives/Alaskans are Colville (8.0%, a difference of 0.050%), Immigrants from Barbados (8.0%, a difference of 0.12%), Immigrants from St. Vincent and the Grenadines (8.0%, a difference of 0.36%), Immigrants from Central America (8.1%, a difference of 0.38%), and Immigrants from Bahamas (8.0%, a difference of 0.44%). Similarly, the demographic groups most similar to Immigrants from Western Africa are Immigrants from Mexico (8.2%, a difference of 0.030%), Immigrants from Grenada (8.2%, a difference of 0.15%), African (8.2%, a difference of 0.15%), Immigrants from Honduras (8.2%, a difference of 0.28%), and Bangladeshi (8.1%, a difference of 0.31%).
| Demographics | Rating | Rank | Single Mother Households |
| Houma | 0.0 /100 | #299 | Tragic 7.9% |
| Mexicans | 0.0 /100 | #300 | Tragic 8.0% |
| Chippewa | 0.0 /100 | #301 | Tragic 8.0% |
| Immigrants | Ghana | 0.0 /100 | #302 | Tragic 8.0% |
| Immigrants | Bahamas | 0.0 /100 | #303 | Tragic 8.0% |
| Natives/Alaskans | 0.0 /100 | #304 | Tragic 8.0% |
| Colville | 0.0 /100 | #305 | Tragic 8.0% |
| Immigrants | Barbados | 0.0 /100 | #306 | Tragic 8.0% |
| Immigrants | St. Vincent and the Grenadines | 0.0 /100 | #307 | Tragic 8.0% |
| Immigrants | Central America | 0.0 /100 | #308 | Tragic 8.1% |
| Cheyenne | 0.0 /100 | #309 | Tragic 8.1% |
| Hondurans | 0.0 /100 | #310 | Tragic 8.1% |
| Immigrants | Congo | 0.0 /100 | #311 | Tragic 8.1% |
| Bangladeshis | 0.0 /100 | #312 | Tragic 8.1% |
| Immigrants | Grenada | 0.0 /100 | #313 | Tragic 8.2% |
| Immigrants | Mexico | 0.0 /100 | #314 | Tragic 8.2% |
| Immigrants | Western Africa | 0.0 /100 | #315 | Tragic 8.2% |
| Africans | 0.0 /100 | #316 | Tragic 8.2% |
| Immigrants | Honduras | 0.0 /100 | #317 | Tragic 8.2% |
| Senegalese | 0.0 /100 | #318 | Tragic 8.2% |
| Jamaicans | 0.0 /100 | #319 | Tragic 8.2% |