Macedonian vs African Married-couple Households
COMPARE
Macedonian
African
Married-couple Households
Married-couple Households Comparison
Macedonians
Africans
47.6%
MARRIED-COUPLE HOUSEHOLDS
93.9/ 100
METRIC RATING
110th/ 347
METRIC RANK
40.9%
MARRIED-COUPLE HOUSEHOLDS
0.0/ 100
METRIC RATING
312th/ 347
METRIC RANK
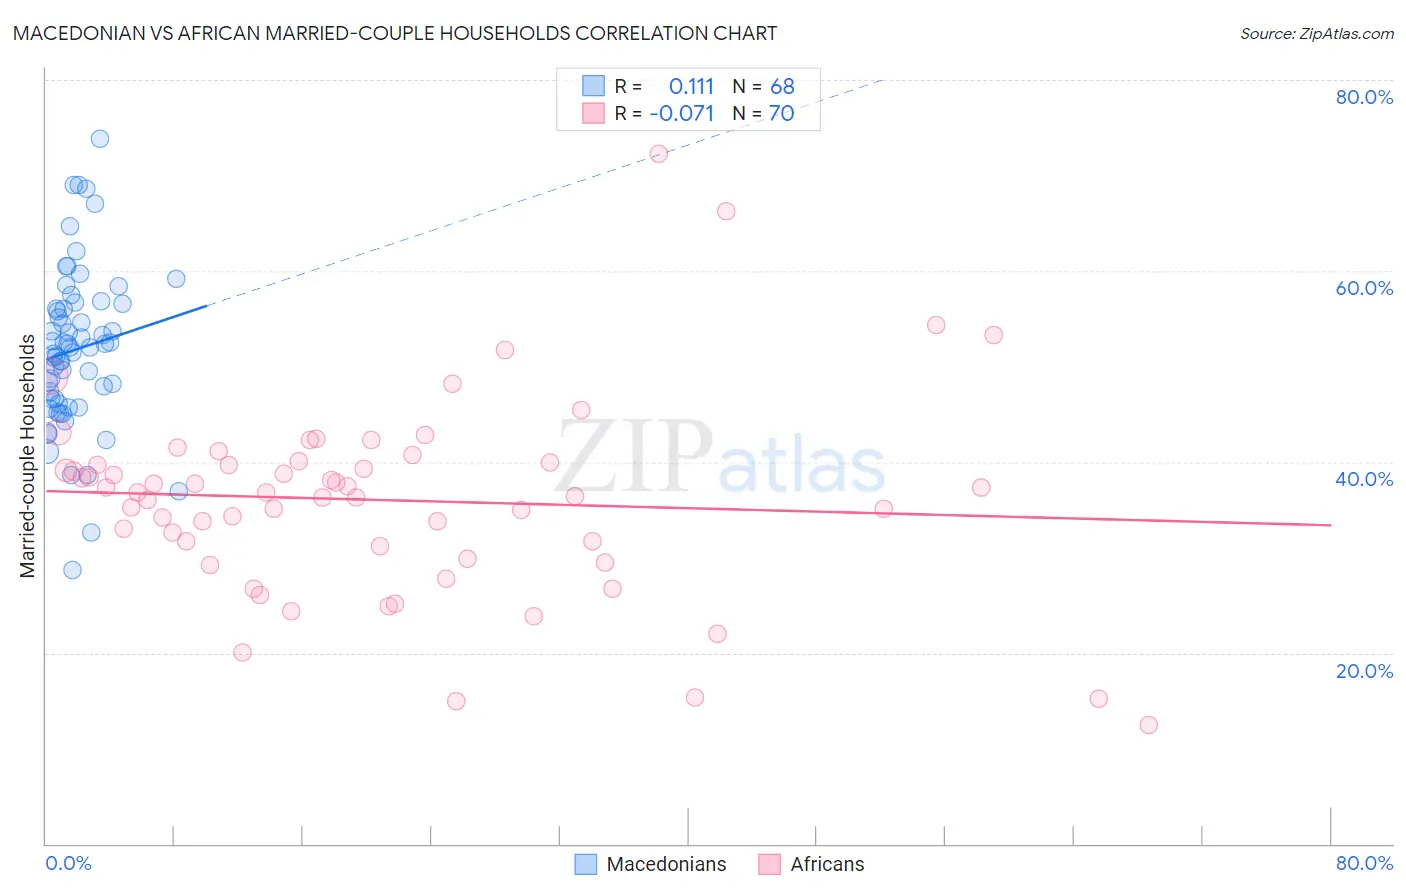
Macedonian vs African Married-couple Households Correlation Chart
The statistical analysis conducted on geographies consisting of 132,608,945 people shows a poor positive correlation between the proportion of Macedonians and percentage of married-couple family households in the United States with a correlation coefficient (R) of 0.111 and weighted average of 47.6%. Similarly, the statistical analysis conducted on geographies consisting of 469,585,166 people shows a slight negative correlation between the proportion of Africans and percentage of married-couple family households in the United States with a correlation coefficient (R) of -0.071 and weighted average of 40.9%, a difference of 16.4%.
Married-couple Households Correlation Summary
| Measurement | Macedonian | African |
| Minimum | 28.7% | 12.5% |
| Maximum | 73.8% | 72.3% |
| Range | 45.2% | 59.8% |
| Mean | 51.8% | 36.0% |
| Median | 52.0% | 36.7% |
| Interquartile 25% (IQ1) | 46.3% | 31.1% |
| Interquartile 75% (IQ3) | 56.3% | 39.9% |
| Interquartile Range (IQR) | 10.0% | 8.8% |
| Standard Deviation (Sample) | 8.4% | 10.3% |
| Standard Deviation (Population) | 8.3% | 10.2% |
Similar Demographics by Married-couple Households
Demographics Similar to Macedonians by Married-couple Households
In terms of married-couple households, the demographic groups most similar to Macedonians are Syrian (47.6%, a difference of 0.0%), Immigrants from Jordan (47.7%, a difference of 0.020%), Peruvian (47.6%, a difference of 0.020%), Venezuelan (47.6%, a difference of 0.030%), and Immigrants from Europe (47.6%, a difference of 0.030%).
| Demographics | Rating | Rank | Married-couple Households |
| Hawaiians | 96.0 /100 | #103 | Exceptional 47.8% |
| Immigrants | South Africa | 96.0 /100 | #104 | Exceptional 47.8% |
| Immigrants | Czechoslovakia | 95.5 /100 | #105 | Exceptional 47.8% |
| Portuguese | 95.5 /100 | #106 | Exceptional 47.8% |
| Estonians | 94.7 /100 | #107 | Exceptional 47.7% |
| Immigrants | Japan | 94.4 /100 | #108 | Exceptional 47.7% |
| Immigrants | Jordan | 94.1 /100 | #109 | Exceptional 47.7% |
| Macedonians | 93.9 /100 | #110 | Exceptional 47.6% |
| Syrians | 93.9 /100 | #111 | Exceptional 47.6% |
| Peruvians | 93.8 /100 | #112 | Exceptional 47.6% |
| Venezuelans | 93.8 /100 | #113 | Exceptional 47.6% |
| Immigrants | Europe | 93.7 /100 | #114 | Exceptional 47.6% |
| Slovaks | 92.9 /100 | #115 | Exceptional 47.6% |
| Argentineans | 92.5 /100 | #116 | Exceptional 47.5% |
| French Canadians | 92.4 /100 | #117 | Exceptional 47.5% |
Demographics Similar to Africans by Married-couple Households
In terms of married-couple households, the demographic groups most similar to Africans are Immigrants from Haiti (40.9%, a difference of 0.060%), Colville (41.0%, a difference of 0.090%), Jamaican (40.9%, a difference of 0.14%), Trinidadian and Tobagonian (40.9%, a difference of 0.22%), and Immigrants from Caribbean (40.8%, a difference of 0.40%).
| Demographics | Rating | Rank | Married-couple Households |
| Sioux | 0.0 /100 | #305 | Tragic 41.5% |
| Guyanese | 0.0 /100 | #306 | Tragic 41.4% |
| Immigrants | Western Africa | 0.0 /100 | #307 | Tragic 41.4% |
| Crow | 0.0 /100 | #308 | Tragic 41.4% |
| Immigrants | Trinidad and Tobago | 0.0 /100 | #309 | Tragic 41.2% |
| Haitians | 0.0 /100 | #310 | Tragic 41.2% |
| Colville | 0.0 /100 | #311 | Tragic 41.0% |
| Africans | 0.0 /100 | #312 | Tragic 40.9% |
| Immigrants | Haiti | 0.0 /100 | #313 | Tragic 40.9% |
| Jamaicans | 0.0 /100 | #314 | Tragic 40.9% |
| Trinidadians and Tobagonians | 0.0 /100 | #315 | Tragic 40.9% |
| Immigrants | Caribbean | 0.0 /100 | #316 | Tragic 40.8% |
| Immigrants | Jamaica | 0.0 /100 | #317 | Tragic 40.7% |
| Liberians | 0.0 /100 | #318 | Tragic 40.7% |
| Bahamians | 0.0 /100 | #319 | Tragic 40.5% |