Korean vs Immigrants from Greece Family Households
COMPARE
Korean
Immigrants from Greece
Family Households
Family Households Comparison
Koreans
Immigrants from Greece
68.3%
FAMILY HOUSEHOLDS
100.0/ 100
METRIC RATING
12th/ 347
METRIC RANK
63.5%
FAMILY HOUSEHOLDS
2.9/ 100
METRIC RATING
231st/ 347
METRIC RANK
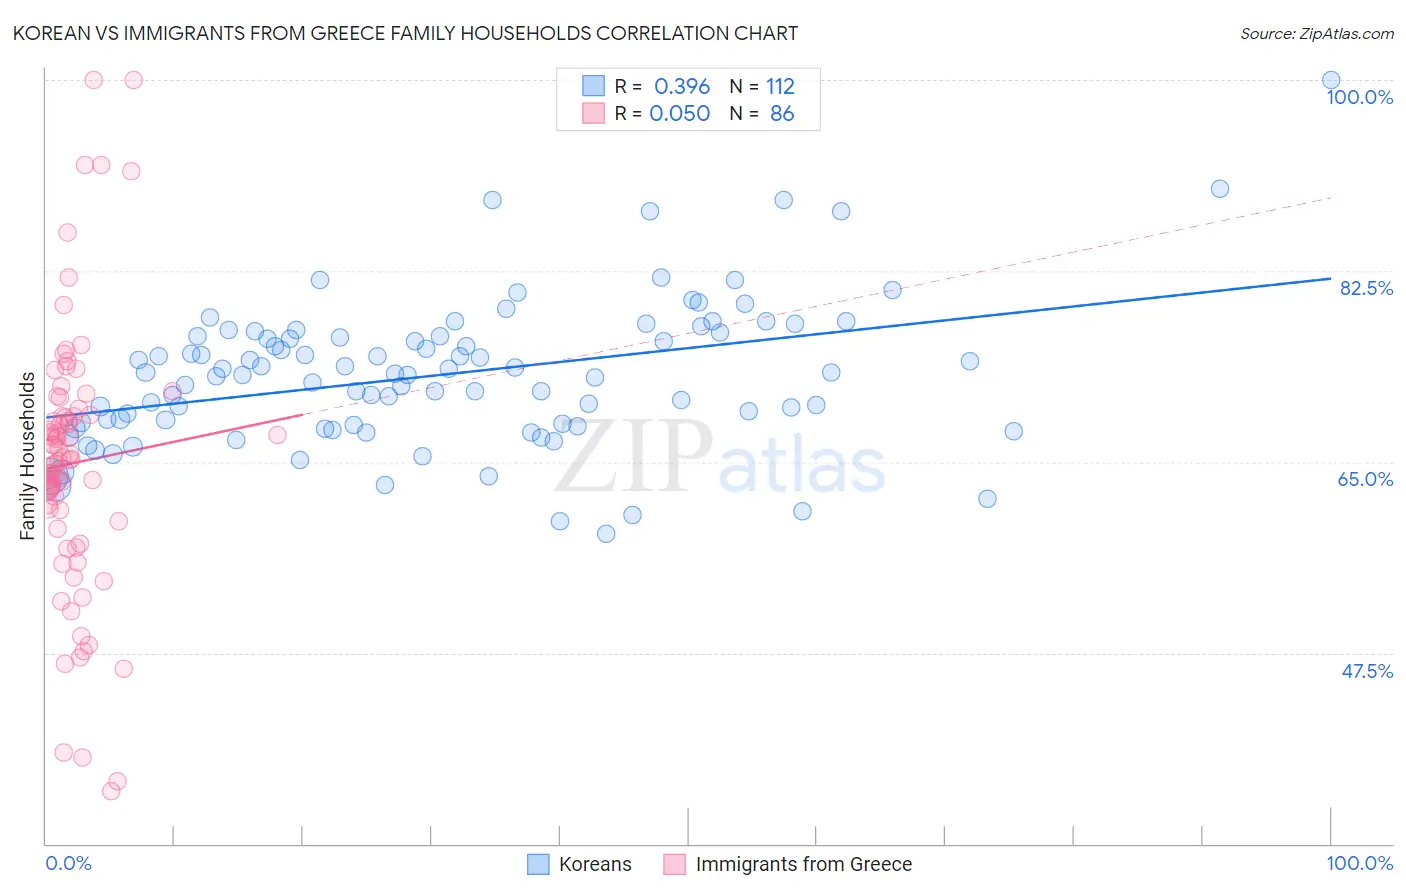
Korean vs Immigrants from Greece Family Households Correlation Chart
The statistical analysis conducted on geographies consisting of 510,403,530 people shows a mild positive correlation between the proportion of Koreans and percentage of family households in the United States with a correlation coefficient (R) of 0.396 and weighted average of 68.3%. Similarly, the statistical analysis conducted on geographies consisting of 216,856,850 people shows no correlation between the proportion of Immigrants from Greece and percentage of family households in the United States with a correlation coefficient (R) of 0.050 and weighted average of 63.5%, a difference of 7.4%.
Family Households Correlation Summary
| Measurement | Korean | Immigrants from Greece |
| Minimum | 58.5% | 34.8% |
| Maximum | 100.0% | 100.0% |
| Range | 41.5% | 65.2% |
| Mean | 73.0% | 64.9% |
| Median | 73.1% | 65.2% |
| Interquartile 25% (IQ1) | 68.4% | 59.6% |
| Interquartile 75% (IQ3) | 76.5% | 69.3% |
| Interquartile Range (IQR) | 8.1% | 9.7% |
| Standard Deviation (Sample) | 6.7% | 12.3% |
| Standard Deviation (Population) | 6.7% | 12.3% |
Similar Demographics by Family Households
Demographics Similar to Koreans by Family Households
In terms of family households, the demographic groups most similar to Koreans are Immigrants from Central America (68.3%, a difference of 0.030%), Pueblo (68.2%, a difference of 0.080%), Immigrants from Cuba (68.2%, a difference of 0.090%), Immigrants from Philippines (68.3%, a difference of 0.10%), and Assyrian/Chaldean/Syriac (68.2%, a difference of 0.15%).
| Demographics | Rating | Rank | Family Households |
| Yuman | 100.0 /100 | #5 | Exceptional 69.3% |
| Immigrants | Mexico | 100.0 /100 | #6 | Exceptional 69.1% |
| Mexicans | 100.0 /100 | #7 | Exceptional 69.0% |
| Immigrants | Fiji | 100.0 /100 | #8 | Exceptional 68.8% |
| Native Hawaiians | 100.0 /100 | #9 | Exceptional 68.4% |
| Immigrants | Philippines | 100.0 /100 | #10 | Exceptional 68.3% |
| Immigrants | Central America | 100.0 /100 | #11 | Exceptional 68.3% |
| Koreans | 100.0 /100 | #12 | Exceptional 68.3% |
| Pueblo | 100.0 /100 | #13 | Exceptional 68.2% |
| Immigrants | Cuba | 100.0 /100 | #14 | Exceptional 68.2% |
| Assyrians/Chaldeans/Syriacs | 100.0 /100 | #15 | Exceptional 68.2% |
| Immigrants | Vietnam | 100.0 /100 | #16 | Exceptional 68.2% |
| Chinese | 100.0 /100 | #17 | Exceptional 68.1% |
| Immigrants | Taiwan | 100.0 /100 | #18 | Exceptional 68.0% |
| Samoans | 100.0 /100 | #19 | Exceptional 67.9% |
Demographics Similar to Immigrants from Greece by Family Households
In terms of family households, the demographic groups most similar to Immigrants from Greece are Immigrants from Brazil (63.6%, a difference of 0.020%), Immigrants from Northern Africa (63.5%, a difference of 0.030%), Immigrants from Armenia (63.5%, a difference of 0.050%), Bulgarian (63.6%, a difference of 0.060%), and Blackfeet (63.6%, a difference of 0.070%).
| Demographics | Rating | Rank | Family Households |
| Turks | 4.5 /100 | #224 | Tragic 63.6% |
| Immigrants | Hungary | 4.3 /100 | #225 | Tragic 63.6% |
| Immigrants | Bahamas | 4.2 /100 | #226 | Tragic 63.6% |
| Trinidadians and Tobagonians | 4.1 /100 | #227 | Tragic 63.6% |
| Blackfeet | 3.6 /100 | #228 | Tragic 63.6% |
| Bulgarians | 3.4 /100 | #229 | Tragic 63.6% |
| Immigrants | Brazil | 3.0 /100 | #230 | Tragic 63.6% |
| Immigrants | Greece | 2.9 /100 | #231 | Tragic 63.5% |
| Immigrants | Northern Africa | 2.6 /100 | #232 | Tragic 63.5% |
| Immigrants | Armenia | 2.6 /100 | #233 | Tragic 63.5% |
| Finns | 2.3 /100 | #234 | Tragic 63.5% |
| Albanians | 2.2 /100 | #235 | Tragic 63.5% |
| Ghanaians | 2.1 /100 | #236 | Tragic 63.5% |
| Comanche | 2.1 /100 | #237 | Tragic 63.5% |
| Immigrants | Zimbabwe | 2.0 /100 | #238 | Tragic 63.5% |