Macedonian vs Immigrants from Greece Family Households
COMPARE
Macedonian
Immigrants from Greece
Family Households
Family Households Comparison
Macedonians
Immigrants from Greece
63.7%
FAMILY HOUSEHOLDS
6.5/ 100
METRIC RATING
219th/ 347
METRIC RANK
63.5%
FAMILY HOUSEHOLDS
2.9/ 100
METRIC RATING
231st/ 347
METRIC RANK
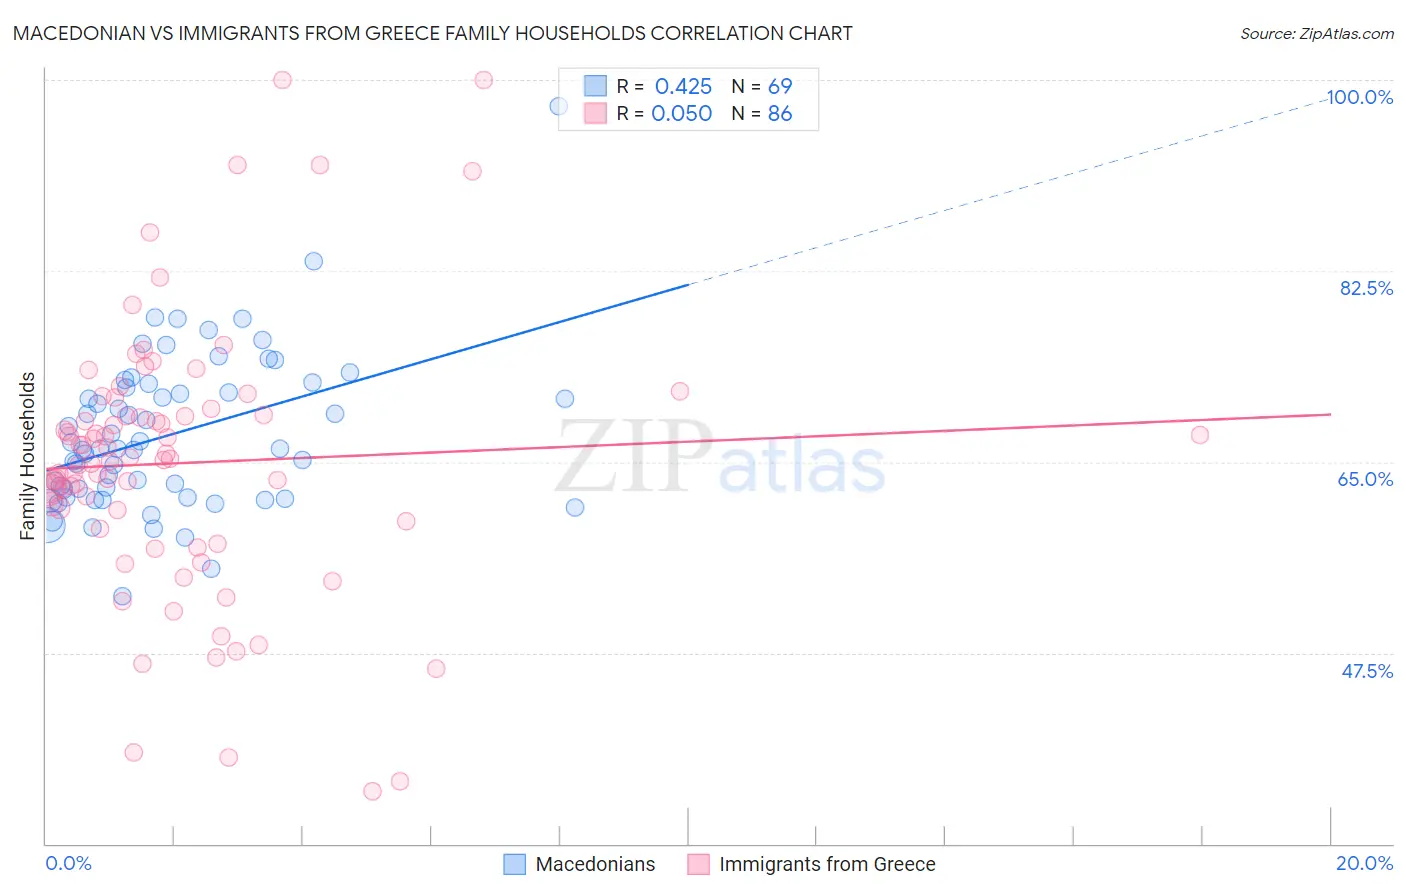
Macedonian vs Immigrants from Greece Family Households Correlation Chart
The statistical analysis conducted on geographies consisting of 132,622,141 people shows a moderate positive correlation between the proportion of Macedonians and percentage of family households in the United States with a correlation coefficient (R) of 0.425 and weighted average of 63.7%. Similarly, the statistical analysis conducted on geographies consisting of 216,856,850 people shows no correlation between the proportion of Immigrants from Greece and percentage of family households in the United States with a correlation coefficient (R) of 0.050 and weighted average of 63.5%, a difference of 0.28%.
Family Households Correlation Summary
| Measurement | Macedonian | Immigrants from Greece |
| Minimum | 52.7% | 34.8% |
| Maximum | 97.6% | 100.0% |
| Range | 44.8% | 65.2% |
| Mean | 67.5% | 64.9% |
| Median | 66.2% | 65.2% |
| Interquartile 25% (IQ1) | 61.7% | 59.6% |
| Interquartile 75% (IQ3) | 72.0% | 69.3% |
| Interquartile Range (IQR) | 10.2% | 9.7% |
| Standard Deviation (Sample) | 7.2% | 12.3% |
| Standard Deviation (Population) | 7.2% | 12.3% |
Demographics Similar to Macedonians and Immigrants from Greece by Family Households
In terms of family households, the demographic groups most similar to Macedonians are Immigrants from Europe (63.7%, a difference of 0.010%), Osage (63.7%, a difference of 0.030%), Marshallese (63.7%, a difference of 0.030%), Immigrants from South Africa (63.7%, a difference of 0.030%), and Croatian (63.8%, a difference of 0.040%). Similarly, the demographic groups most similar to Immigrants from Greece are Immigrants from Brazil (63.6%, a difference of 0.020%), Immigrants from Northern Africa (63.5%, a difference of 0.030%), Immigrants from Armenia (63.5%, a difference of 0.050%), Bulgarian (63.6%, a difference of 0.060%), and Blackfeet (63.6%, a difference of 0.070%).
| Demographics | Rating | Rank | Family Households |
| Belgians | 7.6 /100 | #215 | Tragic 63.8% |
| Croatians | 7.3 /100 | #216 | Tragic 63.8% |
| Osage | 7.0 /100 | #217 | Tragic 63.7% |
| Marshallese | 6.9 /100 | #218 | Tragic 63.7% |
| Macedonians | 6.5 /100 | #219 | Tragic 63.7% |
| Immigrants | Europe | 6.4 /100 | #220 | Tragic 63.7% |
| Immigrants | South Africa | 5.9 /100 | #221 | Tragic 63.7% |
| Immigrants | Belarus | 5.5 /100 | #222 | Tragic 63.7% |
| French Canadians | 5.4 /100 | #223 | Tragic 63.7% |
| Turks | 4.5 /100 | #224 | Tragic 63.6% |
| Immigrants | Hungary | 4.3 /100 | #225 | Tragic 63.6% |
| Immigrants | Bahamas | 4.2 /100 | #226 | Tragic 63.6% |
| Trinidadians and Tobagonians | 4.1 /100 | #227 | Tragic 63.6% |
| Blackfeet | 3.6 /100 | #228 | Tragic 63.6% |
| Bulgarians | 3.4 /100 | #229 | Tragic 63.6% |
| Immigrants | Brazil | 3.0 /100 | #230 | Tragic 63.6% |
| Immigrants | Greece | 2.9 /100 | #231 | Tragic 63.5% |
| Immigrants | Northern Africa | 2.6 /100 | #232 | Tragic 63.5% |
| Immigrants | Armenia | 2.6 /100 | #233 | Tragic 63.5% |
| Finns | 2.3 /100 | #234 | Tragic 63.5% |
| Albanians | 2.2 /100 | #235 | Tragic 63.5% |