Immigrants from Scotland vs Thai Married-couple Households
COMPARE
Immigrants from Scotland
Thai
Married-couple Households
Married-couple Households Comparison
Immigrants from Scotland
Thais
49.3%
MARRIED-COUPLE HOUSEHOLDS
99.8/ 100
METRIC RATING
26th/ 347
METRIC RANK
51.9%
MARRIED-COUPLE HOUSEHOLDS
100.0/ 100
METRIC RATING
3rd/ 347
METRIC RANK
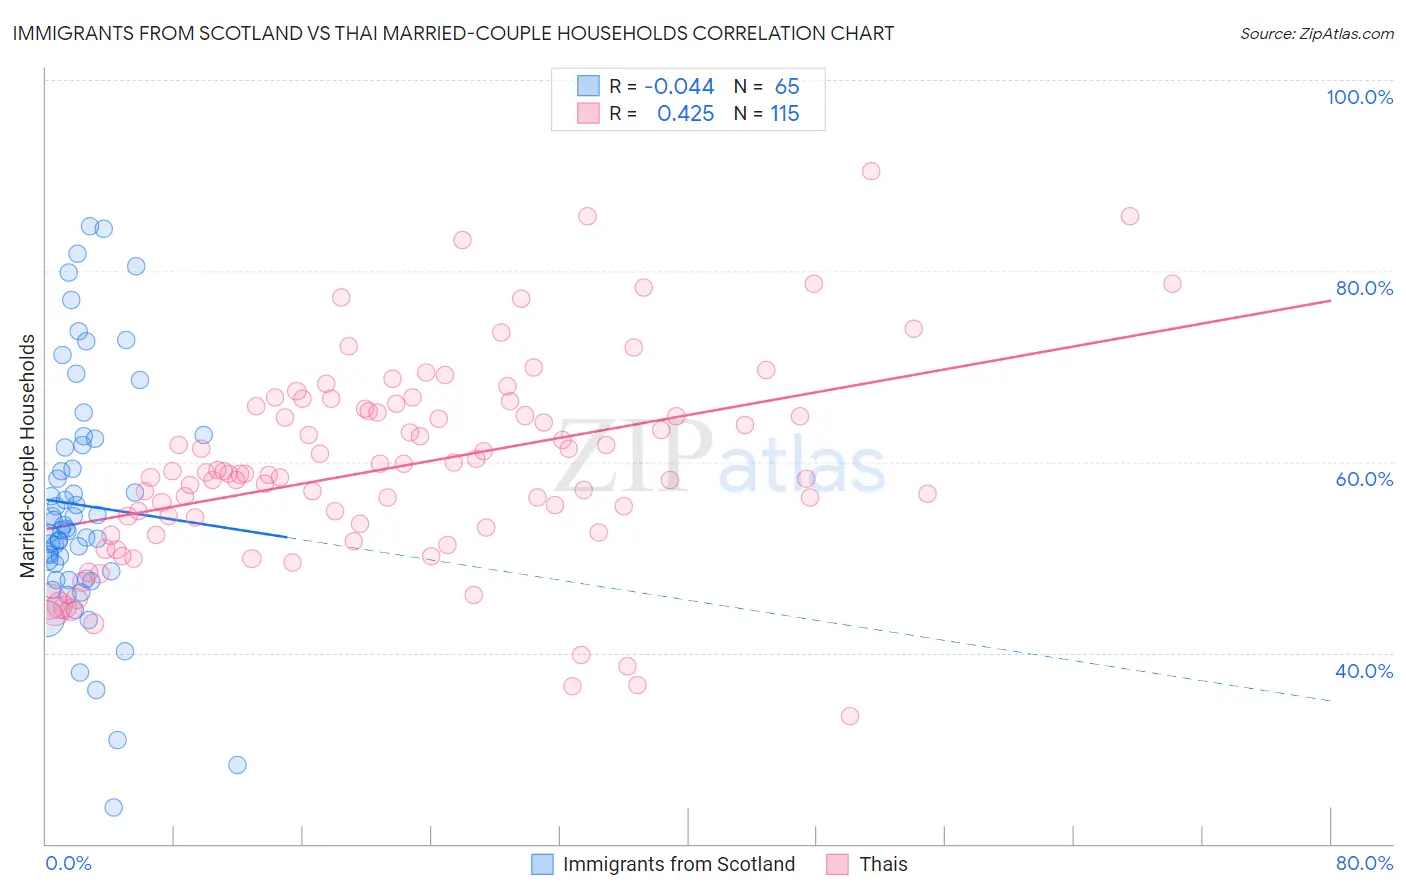
Immigrants from Scotland vs Thai Married-couple Households Correlation Chart
The statistical analysis conducted on geographies consisting of 196,383,501 people shows no correlation between the proportion of Immigrants from Scotland and percentage of married-couple family households in the United States with a correlation coefficient (R) of -0.044 and weighted average of 49.3%. Similarly, the statistical analysis conducted on geographies consisting of 475,348,785 people shows a moderate positive correlation between the proportion of Thais and percentage of married-couple family households in the United States with a correlation coefficient (R) of 0.425 and weighted average of 51.9%, a difference of 5.4%.
Married-couple Households Correlation Summary
| Measurement | Immigrants from Scotland | Thai |
| Minimum | 23.8% | 33.3% |
| Maximum | 84.6% | 90.5% |
| Range | 60.9% | 57.2% |
| Mean | 55.5% | 59.5% |
| Median | 53.0% | 58.8% |
| Interquartile 25% (IQ1) | 48.2% | 53.1% |
| Interquartile 75% (IQ3) | 62.1% | 65.6% |
| Interquartile Range (IQR) | 13.9% | 12.4% |
| Standard Deviation (Sample) | 12.8% | 10.5% |
| Standard Deviation (Population) | 12.7% | 10.5% |
Similar Demographics by Married-couple Households
Demographics Similar to Immigrants from Scotland by Married-couple Households
In terms of married-couple households, the demographic groups most similar to Immigrants from Scotland are Bhutanese (49.3%, a difference of 0.020%), Immigrants from Philippines (49.3%, a difference of 0.13%), German (49.2%, a difference of 0.21%), Maltese (49.2%, a difference of 0.22%), and Bolivian (49.2%, a difference of 0.23%).
| Demographics | Rating | Rank | Married-couple Households |
| Europeans | 99.9 /100 | #19 | Exceptional 49.6% |
| Scandinavians | 99.9 /100 | #20 | Exceptional 49.6% |
| Norwegians | 99.9 /100 | #21 | Exceptional 49.5% |
| Asians | 99.9 /100 | #22 | Exceptional 49.5% |
| Dutch | 99.9 /100 | #23 | Exceptional 49.5% |
| Czechs | 99.9 /100 | #24 | Exceptional 49.4% |
| Immigrants | Philippines | 99.9 /100 | #25 | Exceptional 49.3% |
| Immigrants | Scotland | 99.8 /100 | #26 | Exceptional 49.3% |
| Bhutanese | 99.8 /100 | #27 | Exceptional 49.3% |
| Germans | 99.8 /100 | #28 | Exceptional 49.2% |
| Maltese | 99.8 /100 | #29 | Exceptional 49.2% |
| Bolivians | 99.8 /100 | #30 | Exceptional 49.2% |
| Native Hawaiians | 99.8 /100 | #31 | Exceptional 49.1% |
| Hungarians | 99.8 /100 | #32 | Exceptional 49.1% |
| Immigrants | Asia | 99.7 /100 | #33 | Exceptional 49.1% |
Demographics Similar to Thais by Married-couple Households
In terms of married-couple households, the demographic groups most similar to Thais are Assyrian/Chaldean/Syriac (51.8%, a difference of 0.21%), Tongan (51.6%, a difference of 0.68%), Immigrants from Taiwan (52.4%, a difference of 0.97%), Immigrants from India (52.7%, a difference of 1.6%), and Danish (51.1%, a difference of 1.7%).
| Demographics | Rating | Rank | Married-couple Households |
| Immigrants | India | 100.0 /100 | #1 | Exceptional 52.7% |
| Immigrants | Taiwan | 100.0 /100 | #2 | Exceptional 52.4% |
| Thais | 100.0 /100 | #3 | Exceptional 51.9% |
| Assyrians/Chaldeans/Syriacs | 100.0 /100 | #4 | Exceptional 51.8% |
| Tongans | 100.0 /100 | #5 | Exceptional 51.6% |
| Danes | 100.0 /100 | #6 | Exceptional 51.1% |
| Filipinos | 100.0 /100 | #7 | Exceptional 51.0% |
| Immigrants | South Central Asia | 100.0 /100 | #8 | Exceptional 50.6% |
| Pennsylvania Germans | 100.0 /100 | #9 | Exceptional 50.4% |
| Chinese | 100.0 /100 | #10 | Exceptional 50.4% |
| Immigrants | Pakistan | 100.0 /100 | #11 | Exceptional 50.1% |
| Swiss | 100.0 /100 | #12 | Exceptional 49.9% |
| Immigrants | Korea | 100.0 /100 | #13 | Exceptional 49.9% |
| Burmese | 100.0 /100 | #14 | Exceptional 49.8% |
| Koreans | 99.9 /100 | #15 | Exceptional 49.7% |