Ute vs Thai Married-couple Households
COMPARE
Ute
Thai
Married-couple Households
Married-couple Households Comparison
Ute
Thais
44.4%
MARRIED-COUPLE HOUSEHOLDS
1.0/ 100
METRIC RATING
240th/ 347
METRIC RANK
51.9%
MARRIED-COUPLE HOUSEHOLDS
100.0/ 100
METRIC RATING
3rd/ 347
METRIC RANK
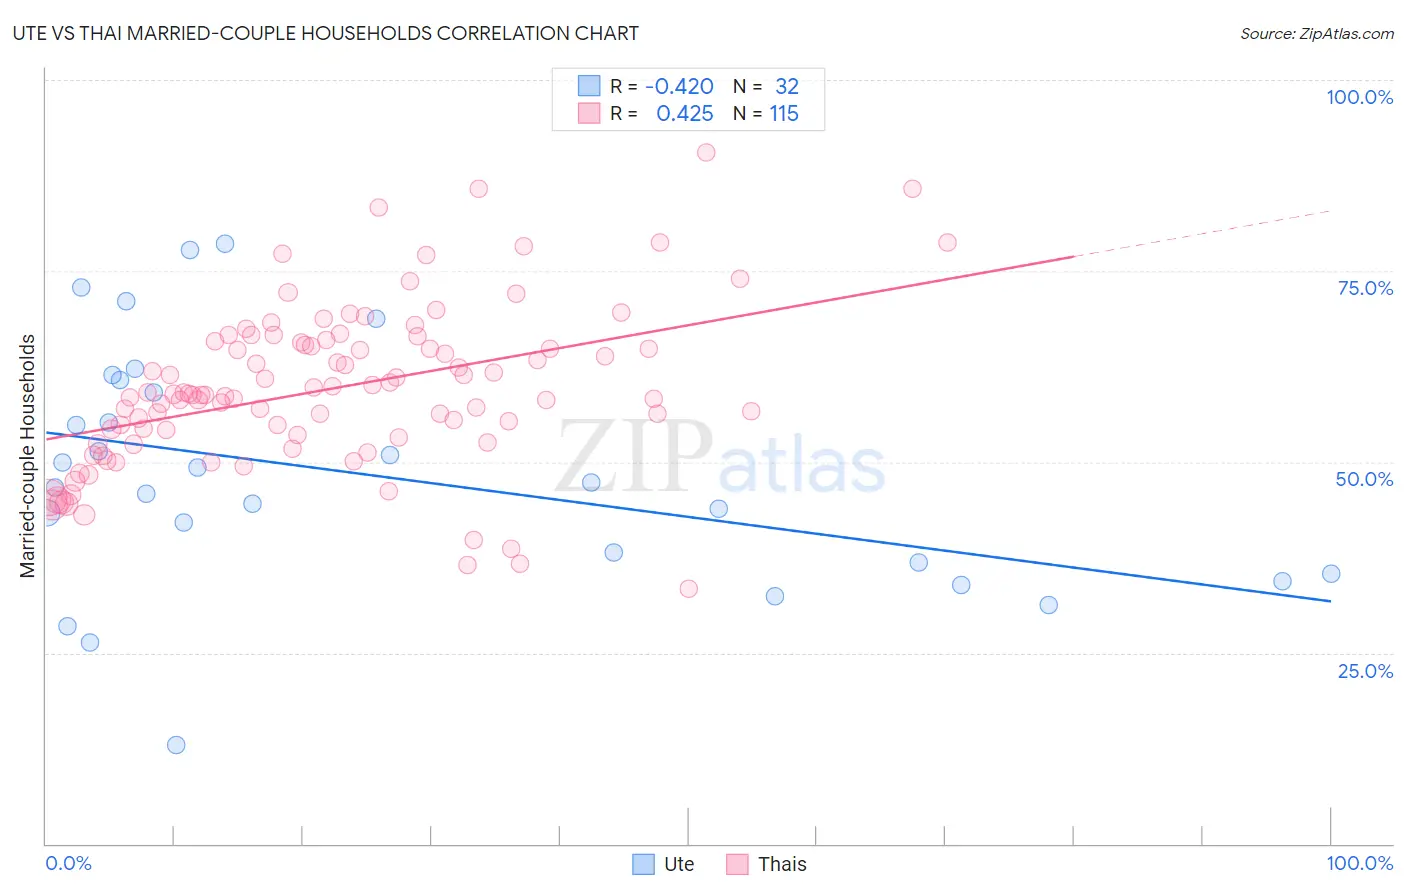
Ute vs Thai Married-couple Households Correlation Chart
The statistical analysis conducted on geographies consisting of 55,658,636 people shows a moderate negative correlation between the proportion of Ute and percentage of married-couple family households in the United States with a correlation coefficient (R) of -0.420 and weighted average of 44.4%. Similarly, the statistical analysis conducted on geographies consisting of 475,348,785 people shows a moderate positive correlation between the proportion of Thais and percentage of married-couple family households in the United States with a correlation coefficient (R) of 0.425 and weighted average of 51.9%, a difference of 16.8%.
Married-couple Households Correlation Summary
| Measurement | Ute | Thai |
| Minimum | 12.9% | 33.3% |
| Maximum | 78.5% | 90.5% |
| Range | 65.6% | 57.2% |
| Mean | 48.4% | 59.5% |
| Median | 47.0% | 58.8% |
| Interquartile 25% (IQ1) | 36.1% | 53.1% |
| Interquartile 75% (IQ3) | 59.9% | 65.6% |
| Interquartile Range (IQR) | 23.8% | 12.4% |
| Standard Deviation (Sample) | 15.7% | 10.5% |
| Standard Deviation (Population) | 15.5% | 10.5% |
Similar Demographics by Married-couple Households
Demographics Similar to Ute by Married-couple Households
In terms of married-couple households, the demographic groups most similar to Ute are Immigrants from Bosnia and Herzegovina (44.4%, a difference of 0.0%), Immigrants from Albania (44.4%, a difference of 0.040%), Spanish American (44.5%, a difference of 0.080%), Immigrants from Uruguay (44.5%, a difference of 0.10%), and Immigrants from Saudi Arabia (44.4%, a difference of 0.11%).
| Demographics | Rating | Rank | Married-couple Households |
| Immigrants | Uganda | 1.5 /100 | #233 | Tragic 44.6% |
| Immigrants | Panama | 1.3 /100 | #234 | Tragic 44.6% |
| Immigrants | Nicaragua | 1.2 /100 | #235 | Tragic 44.5% |
| Yaqui | 1.2 /100 | #236 | Tragic 44.5% |
| Comanche | 1.2 /100 | #237 | Tragic 44.5% |
| Immigrants | Uruguay | 1.1 /100 | #238 | Tragic 44.5% |
| Spanish Americans | 1.1 /100 | #239 | Tragic 44.5% |
| Ute | 1.0 /100 | #240 | Tragic 44.4% |
| Immigrants | Bosnia and Herzegovina | 1.0 /100 | #241 | Tragic 44.4% |
| Immigrants | Albania | 1.0 /100 | #242 | Tragic 44.4% |
| Immigrants | Saudi Arabia | 0.9 /100 | #243 | Tragic 44.4% |
| Immigrants | Armenia | 0.7 /100 | #244 | Tragic 44.3% |
| Immigrants | El Salvador | 0.7 /100 | #245 | Tragic 44.3% |
| Immigrants | Cuba | 0.6 /100 | #246 | Tragic 44.2% |
| Immigrants | Morocco | 0.6 /100 | #247 | Tragic 44.2% |
Demographics Similar to Thais by Married-couple Households
In terms of married-couple households, the demographic groups most similar to Thais are Assyrian/Chaldean/Syriac (51.8%, a difference of 0.21%), Tongan (51.6%, a difference of 0.68%), Immigrants from Taiwan (52.4%, a difference of 0.97%), Immigrants from India (52.7%, a difference of 1.6%), and Danish (51.1%, a difference of 1.7%).
| Demographics | Rating | Rank | Married-couple Households |
| Immigrants | India | 100.0 /100 | #1 | Exceptional 52.7% |
| Immigrants | Taiwan | 100.0 /100 | #2 | Exceptional 52.4% |
| Thais | 100.0 /100 | #3 | Exceptional 51.9% |
| Assyrians/Chaldeans/Syriacs | 100.0 /100 | #4 | Exceptional 51.8% |
| Tongans | 100.0 /100 | #5 | Exceptional 51.6% |
| Danes | 100.0 /100 | #6 | Exceptional 51.1% |
| Filipinos | 100.0 /100 | #7 | Exceptional 51.0% |
| Immigrants | South Central Asia | 100.0 /100 | #8 | Exceptional 50.6% |
| Pennsylvania Germans | 100.0 /100 | #9 | Exceptional 50.4% |
| Chinese | 100.0 /100 | #10 | Exceptional 50.4% |
| Immigrants | Pakistan | 100.0 /100 | #11 | Exceptional 50.1% |
| Swiss | 100.0 /100 | #12 | Exceptional 49.9% |
| Immigrants | Korea | 100.0 /100 | #13 | Exceptional 49.9% |
| Burmese | 100.0 /100 | #14 | Exceptional 49.8% |
| Koreans | 99.9 /100 | #15 | Exceptional 49.7% |