Immigrants from Pakistan vs Subsaharan African Family Households with Children
COMPARE
Immigrants from Pakistan
Subsaharan African
Family Households with Children
Family Households with Children Comparison
Immigrants from Pakistan
Sub-Saharan Africans
30.2%
FAMILY HOUSEHOLDS WITH CHILDREN
100.0/ 100
METRIC RATING
12th/ 347
METRIC RANK
27.6%
FAMILY HOUSEHOLDS WITH CHILDREN
67.5/ 100
METRIC RATING
160th/ 347
METRIC RANK
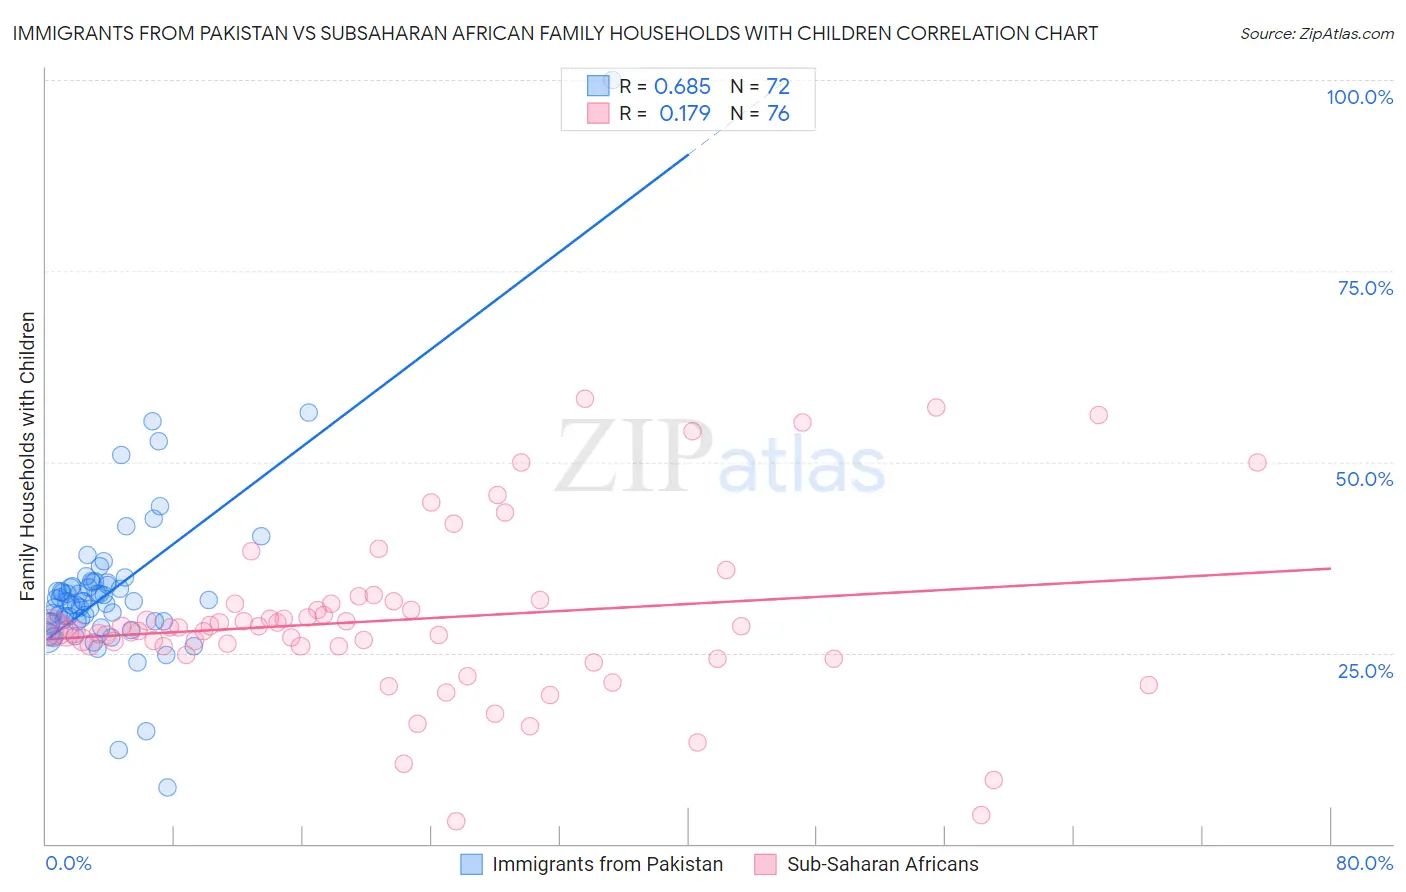
Immigrants from Pakistan vs Subsaharan African Family Households with Children Correlation Chart
The statistical analysis conducted on geographies consisting of 283,710,080 people shows a significant positive correlation between the proportion of Immigrants from Pakistan and percentage of family households with children in the United States with a correlation coefficient (R) of 0.685 and weighted average of 30.2%. Similarly, the statistical analysis conducted on geographies consisting of 507,337,784 people shows a poor positive correlation between the proportion of Sub-Saharan Africans and percentage of family households with children in the United States with a correlation coefficient (R) of 0.179 and weighted average of 27.6%, a difference of 9.8%.
Family Households with Children Correlation Summary
| Measurement | Immigrants from Pakistan | Subsaharan African |
| Minimum | 7.4% | 3.0% |
| Maximum | 100.0% | 58.3% |
| Range | 92.6% | 55.4% |
| Mean | 33.0% | 29.4% |
| Median | 31.8% | 28.2% |
| Interquartile 25% (IQ1) | 29.1% | 25.8% |
| Interquartile 75% (IQ3) | 34.0% | 31.4% |
| Interquartile Range (IQR) | 4.9% | 5.6% |
| Standard Deviation (Sample) | 11.1% | 11.1% |
| Standard Deviation (Population) | 11.0% | 11.0% |
Similar Demographics by Family Households with Children
Demographics Similar to Immigrants from Pakistan by Family Households with Children
In terms of family households with children, the demographic groups most similar to Immigrants from Pakistan are Afghan (30.2%, a difference of 0.24%), Bangladeshi (30.1%, a difference of 0.52%), Immigrants from South Central Asia (30.0%, a difference of 0.69%), Immigrants from Afghanistan (30.0%, a difference of 0.72%), and Nepalese (30.5%, a difference of 0.88%).
| Demographics | Rating | Rank | Family Households with Children |
| Tongans | 100.0 /100 | #5 | Exceptional 31.2% |
| Immigrants | India | 100.0 /100 | #6 | Exceptional 31.0% |
| Immigrants | Central America | 100.0 /100 | #7 | Exceptional 31.0% |
| Yakama | 100.0 /100 | #8 | Exceptional 30.8% |
| Thais | 100.0 /100 | #9 | Exceptional 30.6% |
| Immigrants | Fiji | 100.0 /100 | #10 | Exceptional 30.5% |
| Nepalese | 100.0 /100 | #11 | Exceptional 30.5% |
| Immigrants | Pakistan | 100.0 /100 | #12 | Exceptional 30.2% |
| Afghans | 100.0 /100 | #13 | Exceptional 30.2% |
| Bangladeshis | 100.0 /100 | #14 | Exceptional 30.1% |
| Immigrants | South Central Asia | 100.0 /100 | #15 | Exceptional 30.0% |
| Immigrants | Afghanistan | 100.0 /100 | #16 | Exceptional 30.0% |
| Hispanics or Latinos | 100.0 /100 | #17 | Exceptional 29.9% |
| Salvadorans | 100.0 /100 | #18 | Exceptional 29.9% |
| Alaska Natives | 100.0 /100 | #19 | Exceptional 29.9% |
Demographics Similar to Sub-Saharan Africans by Family Households with Children
In terms of family households with children, the demographic groups most similar to Sub-Saharan Africans are Alaskan Athabascan (27.6%, a difference of 0.010%), Immigrants from Bangladesh (27.6%, a difference of 0.010%), Czech (27.5%, a difference of 0.050%), Immigrants from Hong Kong (27.5%, a difference of 0.060%), and Romanian (27.6%, a difference of 0.080%).
| Demographics | Rating | Rank | Family Households with Children |
| Immigrants | Cabo Verde | 75.6 /100 | #153 | Good 27.6% |
| Icelanders | 75.3 /100 | #154 | Good 27.6% |
| Comanche | 74.8 /100 | #155 | Good 27.6% |
| Hungarians | 74.6 /100 | #156 | Good 27.6% |
| Indians (Asian) | 71.6 /100 | #157 | Good 27.6% |
| Romanians | 70.8 /100 | #158 | Good 27.6% |
| Mongolians | 70.7 /100 | #159 | Good 27.6% |
| Sub-Saharan Africans | 67.5 /100 | #160 | Good 27.6% |
| Alaskan Athabascans | 67.1 /100 | #161 | Good 27.6% |
| Immigrants | Bangladesh | 67.0 /100 | #162 | Good 27.6% |
| Czechs | 65.3 /100 | #163 | Good 27.5% |
| Immigrants | Hong Kong | 64.9 /100 | #164 | Good 27.5% |
| Immigrants | South Africa | 61.3 /100 | #165 | Good 27.5% |
| Immigrants | Nonimmigrants | 61.2 /100 | #166 | Good 27.5% |
| Dominicans | 61.1 /100 | #167 | Good 27.5% |