Fijian vs Subsaharan African Family Households with Children
COMPARE
Fijian
Subsaharan African
Family Households with Children
Family Households with Children Comparison
Fijians
Sub-Saharan Africans
29.0%
FAMILY HOUSEHOLDS WITH CHILDREN
100.0/ 100
METRIC RATING
45th/ 347
METRIC RANK
27.6%
FAMILY HOUSEHOLDS WITH CHILDREN
67.5/ 100
METRIC RATING
160th/ 347
METRIC RANK
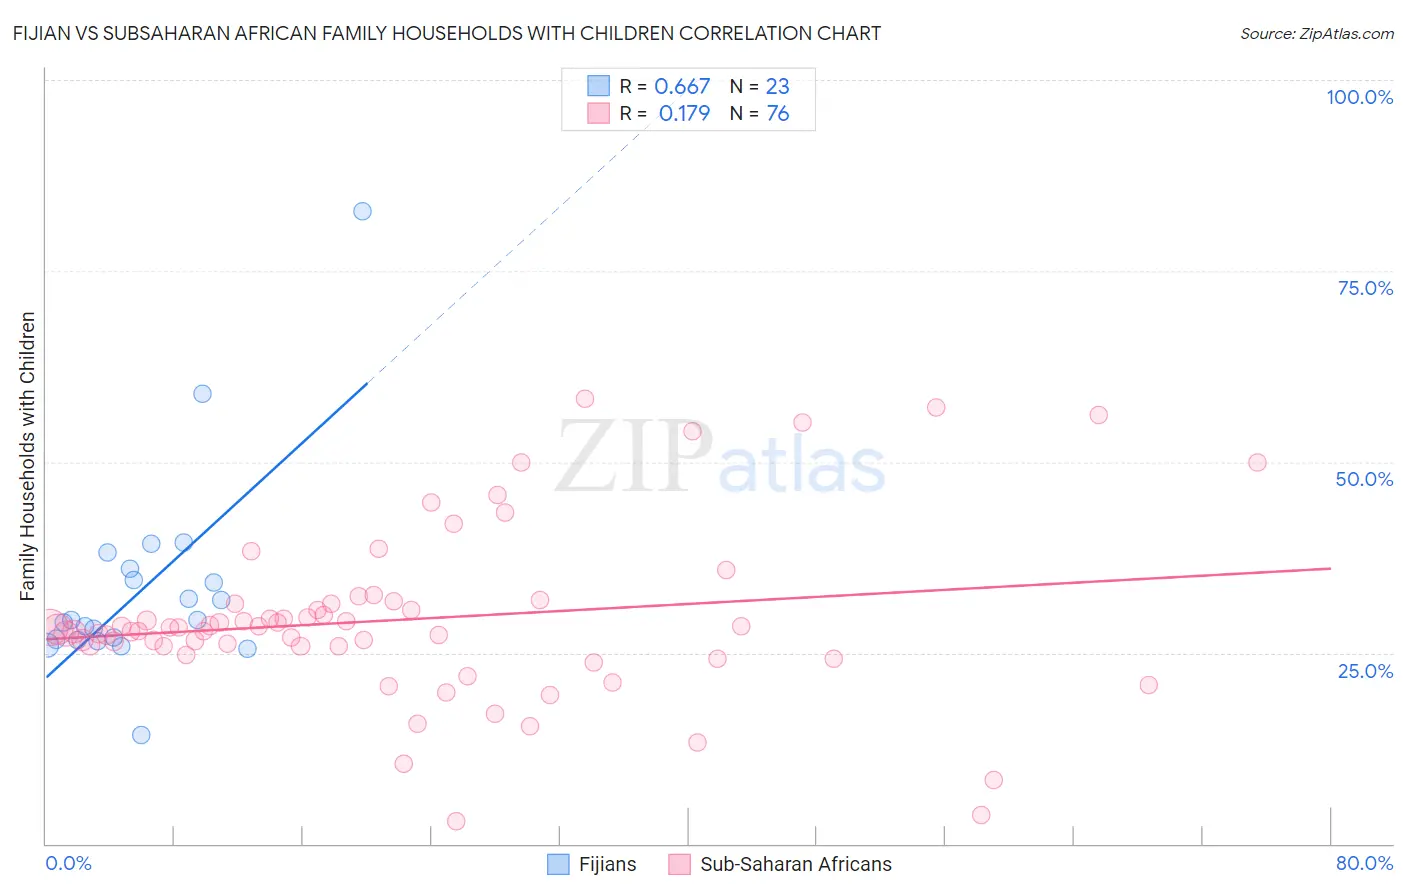
Fijian vs Subsaharan African Family Households with Children Correlation Chart
The statistical analysis conducted on geographies consisting of 55,947,867 people shows a significant positive correlation between the proportion of Fijians and percentage of family households with children in the United States with a correlation coefficient (R) of 0.667 and weighted average of 29.0%. Similarly, the statistical analysis conducted on geographies consisting of 507,337,784 people shows a poor positive correlation between the proportion of Sub-Saharan Africans and percentage of family households with children in the United States with a correlation coefficient (R) of 0.179 and weighted average of 27.6%, a difference of 5.3%.
Family Households with Children Correlation Summary
| Measurement | Fijian | Subsaharan African |
| Minimum | 14.3% | 3.0% |
| Maximum | 82.8% | 58.3% |
| Range | 68.5% | 55.4% |
| Mean | 33.5% | 29.4% |
| Median | 29.2% | 28.2% |
| Interquartile 25% (IQ1) | 26.6% | 25.8% |
| Interquartile 75% (IQ3) | 36.0% | 31.4% |
| Interquartile Range (IQR) | 9.4% | 5.6% |
| Standard Deviation (Sample) | 13.5% | 11.1% |
| Standard Deviation (Population) | 13.2% | 11.0% |
Similar Demographics by Family Households with Children
Demographics Similar to Fijians by Family Households with Children
In terms of family households with children, the demographic groups most similar to Fijians are Immigrants from Taiwan (29.0%, a difference of 0.060%), Immigrants from Philippines (29.0%, a difference of 0.090%), Peruvian (29.0%, a difference of 0.090%), Asian (29.1%, a difference of 0.10%), and Apache (29.0%, a difference of 0.13%).
| Demographics | Rating | Rank | Family Households with Children |
| Koreans | 100.0 /100 | #38 | Exceptional 29.2% |
| Yaqui | 100.0 /100 | #39 | Exceptional 29.1% |
| Central Americans | 100.0 /100 | #40 | Exceptional 29.1% |
| Immigrants | South Eastern Asia | 100.0 /100 | #41 | Exceptional 29.1% |
| Spanish American Indians | 100.0 /100 | #42 | Exceptional 29.1% |
| Asians | 100.0 /100 | #43 | Exceptional 29.1% |
| Immigrants | Taiwan | 100.0 /100 | #44 | Exceptional 29.0% |
| Fijians | 100.0 /100 | #45 | Exceptional 29.0% |
| Immigrants | Philippines | 100.0 /100 | #46 | Exceptional 29.0% |
| Peruvians | 100.0 /100 | #47 | Exceptional 29.0% |
| Apache | 100.0 /100 | #48 | Exceptional 29.0% |
| Jordanians | 100.0 /100 | #49 | Exceptional 29.0% |
| Immigrants | Immigrants | 100.0 /100 | #50 | Exceptional 28.9% |
| Immigrants | Peru | 100.0 /100 | #51 | Exceptional 28.9% |
| Guatemalans | 100.0 /100 | #52 | Exceptional 28.9% |
Demographics Similar to Sub-Saharan Africans by Family Households with Children
In terms of family households with children, the demographic groups most similar to Sub-Saharan Africans are Alaskan Athabascan (27.6%, a difference of 0.010%), Immigrants from Bangladesh (27.6%, a difference of 0.010%), Czech (27.5%, a difference of 0.050%), Immigrants from Hong Kong (27.5%, a difference of 0.060%), and Romanian (27.6%, a difference of 0.080%).
| Demographics | Rating | Rank | Family Households with Children |
| Immigrants | Cabo Verde | 75.6 /100 | #153 | Good 27.6% |
| Icelanders | 75.3 /100 | #154 | Good 27.6% |
| Comanche | 74.8 /100 | #155 | Good 27.6% |
| Hungarians | 74.6 /100 | #156 | Good 27.6% |
| Indians (Asian) | 71.6 /100 | #157 | Good 27.6% |
| Romanians | 70.8 /100 | #158 | Good 27.6% |
| Mongolians | 70.7 /100 | #159 | Good 27.6% |
| Sub-Saharan Africans | 67.5 /100 | #160 | Good 27.6% |
| Alaskan Athabascans | 67.1 /100 | #161 | Good 27.6% |
| Immigrants | Bangladesh | 67.0 /100 | #162 | Good 27.6% |
| Czechs | 65.3 /100 | #163 | Good 27.5% |
| Immigrants | Hong Kong | 64.9 /100 | #164 | Good 27.5% |
| Immigrants | South Africa | 61.3 /100 | #165 | Good 27.5% |
| Immigrants | Nonimmigrants | 61.2 /100 | #166 | Good 27.5% |
| Dominicans | 61.1 /100 | #167 | Good 27.5% |