Immigrants from Lithuania vs Finnish Married-couple Households
COMPARE
Immigrants from Lithuania
Finnish
Married-couple Households
Married-couple Households Comparison
Immigrants from Lithuania
Finns
48.6%
MARRIED-COUPLE HOUSEHOLDS
99.3/ 100
METRIC RATING
54th/ 347
METRIC RANK
48.1%
MARRIED-COUPLE HOUSEHOLDS
98.0/ 100
METRIC RATING
81st/ 347
METRIC RANK
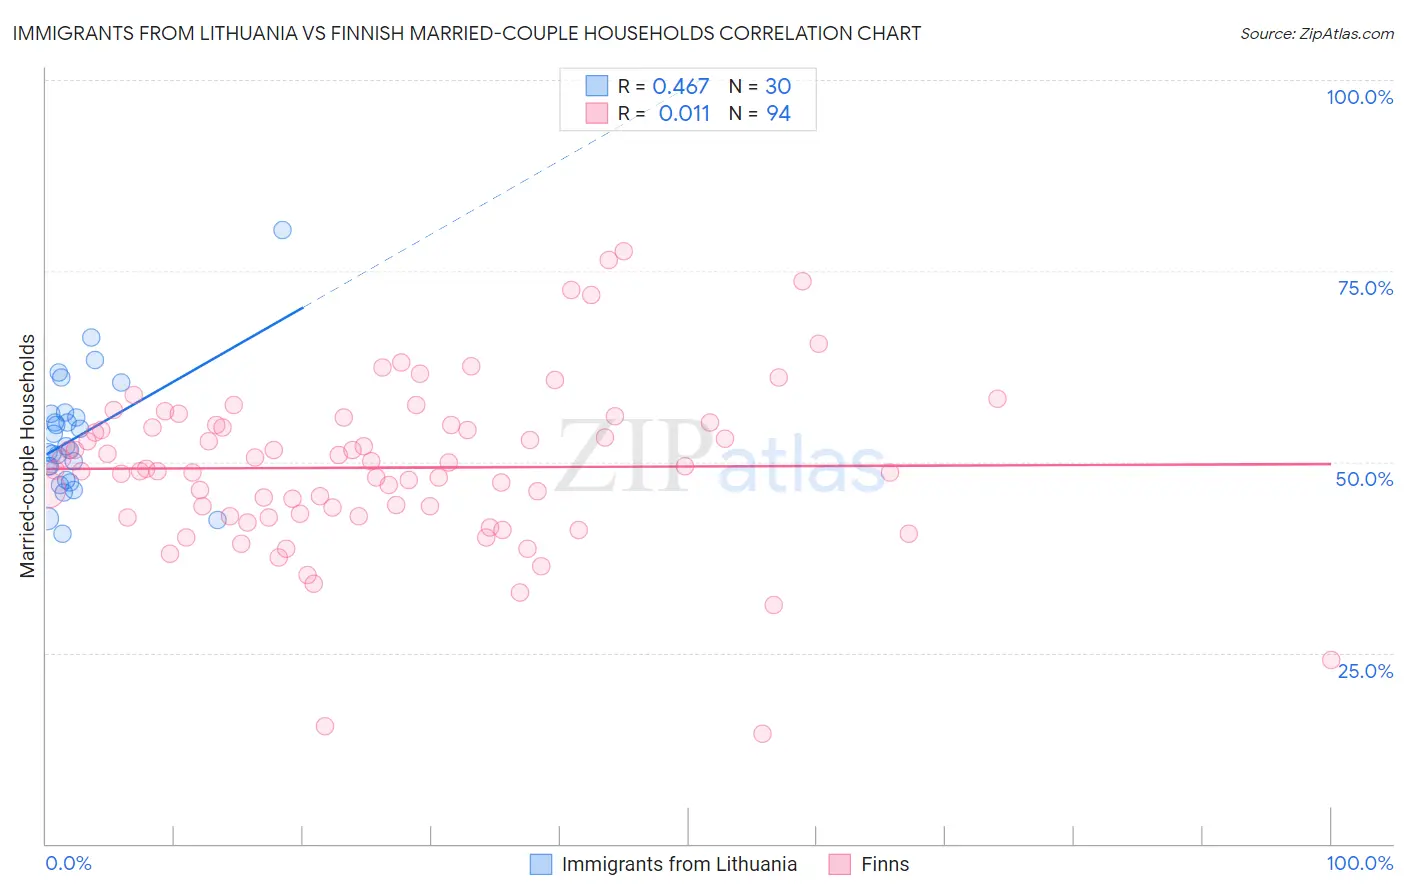
Immigrants from Lithuania vs Finnish Married-couple Households Correlation Chart
The statistical analysis conducted on geographies consisting of 117,713,976 people shows a moderate positive correlation between the proportion of Immigrants from Lithuania and percentage of married-couple family households in the United States with a correlation coefficient (R) of 0.467 and weighted average of 48.6%. Similarly, the statistical analysis conducted on geographies consisting of 404,503,243 people shows no correlation between the proportion of Finns and percentage of married-couple family households in the United States with a correlation coefficient (R) of 0.011 and weighted average of 48.1%, a difference of 0.94%.
Married-couple Households Correlation Summary
| Measurement | Immigrants from Lithuania | Finnish |
| Minimum | 40.7% | 14.4% |
| Maximum | 80.4% | 77.6% |
| Range | 39.7% | 63.1% |
| Mean | 53.3% | 49.2% |
| Median | 51.7% | 49.0% |
| Interquartile 25% (IQ1) | 47.6% | 42.9% |
| Interquartile 75% (IQ3) | 56.4% | 54.8% |
| Interquartile Range (IQR) | 8.7% | 11.8% |
| Standard Deviation (Sample) | 8.1% | 10.8% |
| Standard Deviation (Population) | 7.9% | 10.8% |
Similar Demographics by Married-couple Households
Demographics Similar to Immigrants from Lithuania by Married-couple Households
In terms of married-couple households, the demographic groups most similar to Immigrants from Lithuania are White/Caucasian (48.6%, a difference of 0.010%), Austrian (48.6%, a difference of 0.010%), Immigrants from Northern Europe (48.6%, a difference of 0.010%), Irish (48.6%, a difference of 0.060%), and Eastern European (48.6%, a difference of 0.090%).
| Demographics | Rating | Rank | Married-couple Households |
| British | 99.5 /100 | #47 | Exceptional 48.7% |
| Indians (Asian) | 99.4 /100 | #48 | Exceptional 48.7% |
| Immigrants | Sri Lanka | 99.4 /100 | #49 | Exceptional 48.7% |
| Samoans | 99.4 /100 | #50 | Exceptional 48.7% |
| Eastern Europeans | 99.3 /100 | #51 | Exceptional 48.6% |
| Irish | 99.3 /100 | #52 | Exceptional 48.6% |
| Whites/Caucasians | 99.3 /100 | #53 | Exceptional 48.6% |
| Immigrants | Lithuania | 99.3 /100 | #54 | Exceptional 48.6% |
| Austrians | 99.3 /100 | #55 | Exceptional 48.6% |
| Immigrants | Northern Europe | 99.3 /100 | #56 | Exceptional 48.6% |
| Poles | 99.2 /100 | #57 | Exceptional 48.5% |
| Immigrants | Indonesia | 99.2 /100 | #58 | Exceptional 48.5% |
| Czechoslovakians | 99.2 /100 | #59 | Exceptional 48.5% |
| Croatians | 99.1 /100 | #60 | Exceptional 48.5% |
| Bulgarians | 99.1 /100 | #61 | Exceptional 48.5% |
Demographics Similar to Finns by Married-couple Households
In terms of married-couple households, the demographic groups most similar to Finns are Russian (48.2%, a difference of 0.060%), Egyptian (48.2%, a difference of 0.090%), Immigrants from Netherlands (48.2%, a difference of 0.090%), Canadian (48.2%, a difference of 0.11%), and Immigrants from Poland (48.1%, a difference of 0.14%).
| Demographics | Rating | Rank | Married-couple Households |
| Immigrants | Romania | 98.6 /100 | #74 | Exceptional 48.3% |
| Immigrants | England | 98.4 /100 | #75 | Exceptional 48.2% |
| Immigrants | Fiji | 98.4 /100 | #76 | Exceptional 48.2% |
| Canadians | 98.2 /100 | #77 | Exceptional 48.2% |
| Egyptians | 98.2 /100 | #78 | Exceptional 48.2% |
| Immigrants | Netherlands | 98.2 /100 | #79 | Exceptional 48.2% |
| Russians | 98.1 /100 | #80 | Exceptional 48.2% |
| Finns | 98.0 /100 | #81 | Exceptional 48.1% |
| Immigrants | Poland | 97.7 /100 | #82 | Exceptional 48.1% |
| Guamanians/Chamorros | 97.6 /100 | #83 | Exceptional 48.1% |
| Ukrainians | 97.6 /100 | #84 | Exceptional 48.1% |
| Immigrants | Israel | 97.4 /100 | #85 | Exceptional 48.0% |
| Belgians | 97.4 /100 | #86 | Exceptional 48.0% |
| Immigrants | Ireland | 97.3 /100 | #87 | Exceptional 48.0% |
| Afghans | 97.3 /100 | #88 | Exceptional 48.0% |