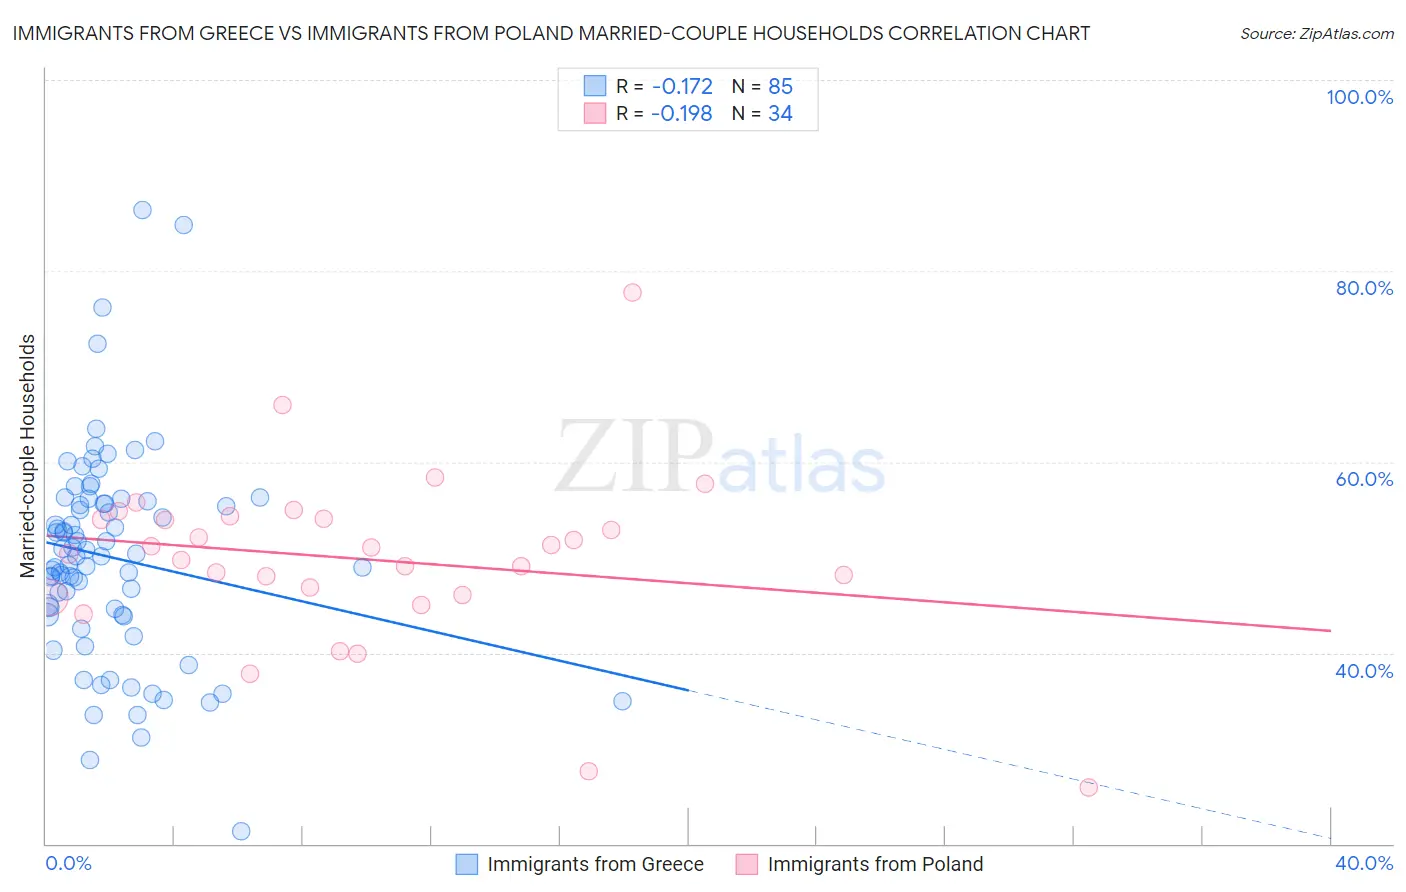
Immigrants from Greece vs Immigrants from Poland Married-couple Households
COMPARE
Immigrants from Greece
Immigrants from Poland
Married-couple Households
Married-couple Households Comparison
Immigrants from Greece
Immigrants from Poland
47.2%
MARRIED-COUPLE HOUSEHOLDS
86.0/ 100
METRIC RATING
134th/ 347
METRIC RANK
48.1%
MARRIED-COUPLE HOUSEHOLDS
97.7/ 100
METRIC RATING
82nd/ 347
METRIC RANK
Immigrants from Greece vs Immigrants from Poland Married-couple Households Correlation Chart
The statistical analysis conducted on geographies consisting of 216,854,856 people shows a poor negative correlation between the proportion of Immigrants from Greece and percentage of married-couple family households in the United States with a correlation coefficient (R) of -0.172 and weighted average of 47.2%. Similarly, the statistical analysis conducted on geographies consisting of 304,780,020 people shows a poor negative correlation between the proportion of Immigrants from Poland and percentage of married-couple family households in the United States with a correlation coefficient (R) of -0.198 and weighted average of 48.1%, a difference of 1.8%.
Married-couple Households Correlation Summary
| Measurement | Immigrants from Greece | Immigrants from Poland |
| Minimum | 21.3% | 25.9% |
| Maximum | 86.4% | 77.7% |
| Range | 65.0% | 51.8% |
| Mean | 50.0% | 49.8% |
| Median | 50.1% | 50.8% |
| Interquartile 25% (IQ1) | 43.9% | 46.0% |
| Interquartile 75% (IQ3) | 55.7% | 54.1% |
| Interquartile Range (IQR) | 11.8% | 8.1% |
| Standard Deviation (Sample) | 11.0% | 9.3% |
| Standard Deviation (Population) | 10.9% | 9.2% |
Similar Demographics by Married-couple Households
Demographics Similar to Immigrants from Greece by Married-couple Households
In terms of married-couple households, the demographic groups most similar to Immigrants from Greece are Immigrants from Argentina (47.2%, a difference of 0.0%), South African (47.3%, a difference of 0.040%), New Zealander (47.2%, a difference of 0.050%), Immigrants from Ukraine (47.3%, a difference of 0.060%), and Immigrants from Malaysia (47.2%, a difference of 0.060%).
| Demographics | Rating | Rank | Married-couple Households |
| Celtics | 88.1 /100 | #127 | Excellent 47.3% |
| Immigrants | Peru | 87.9 /100 | #128 | Excellent 47.3% |
| Immigrants | Iraq | 87.8 /100 | #129 | Excellent 47.3% |
| Immigrants | Hungary | 87.8 /100 | #130 | Excellent 47.3% |
| Immigrants | Denmark | 87.5 /100 | #131 | Excellent 47.3% |
| Immigrants | Ukraine | 86.7 /100 | #132 | Excellent 47.3% |
| South Africans | 86.4 /100 | #133 | Excellent 47.3% |
| Immigrants | Greece | 86.0 /100 | #134 | Excellent 47.2% |
| Immigrants | Argentina | 86.0 /100 | #135 | Excellent 47.2% |
| New Zealanders | 85.3 /100 | #136 | Excellent 47.2% |
| Immigrants | Malaysia | 85.2 /100 | #137 | Excellent 47.2% |
| Immigrants | Afghanistan | 85.1 /100 | #138 | Excellent 47.2% |
| Immigrants | Sweden | 84.7 /100 | #139 | Excellent 47.2% |
| Spanish | 84.5 /100 | #140 | Excellent 47.2% |
| Costa Ricans | 84.4 /100 | #141 | Excellent 47.2% |
Demographics Similar to Immigrants from Poland by Married-couple Households
In terms of married-couple households, the demographic groups most similar to Immigrants from Poland are Guamanian/Chamorro (48.1%, a difference of 0.020%), Ukrainian (48.1%, a difference of 0.040%), Immigrants from Israel (48.0%, a difference of 0.090%), Belgian (48.0%, a difference of 0.11%), and Immigrants from Ireland (48.0%, a difference of 0.13%).
| Demographics | Rating | Rank | Married-couple Households |
| Immigrants | England | 98.4 /100 | #75 | Exceptional 48.2% |
| Immigrants | Fiji | 98.4 /100 | #76 | Exceptional 48.2% |
| Canadians | 98.2 /100 | #77 | Exceptional 48.2% |
| Egyptians | 98.2 /100 | #78 | Exceptional 48.2% |
| Immigrants | Netherlands | 98.2 /100 | #79 | Exceptional 48.2% |
| Russians | 98.1 /100 | #80 | Exceptional 48.2% |
| Finns | 98.0 /100 | #81 | Exceptional 48.1% |
| Immigrants | Poland | 97.7 /100 | #82 | Exceptional 48.1% |
| Guamanians/Chamorros | 97.6 /100 | #83 | Exceptional 48.1% |
| Ukrainians | 97.6 /100 | #84 | Exceptional 48.1% |
| Immigrants | Israel | 97.4 /100 | #85 | Exceptional 48.0% |
| Belgians | 97.4 /100 | #86 | Exceptional 48.0% |
| Immigrants | Ireland | 97.3 /100 | #87 | Exceptional 48.0% |
| Afghans | 97.3 /100 | #88 | Exceptional 48.0% |
| Cypriots | 97.2 /100 | #89 | Exceptional 48.0% |