Immigrants from Greece vs Colville Married-couple Households
COMPARE
Immigrants from Greece
Colville
Married-couple Households
Married-couple Households Comparison
Immigrants from Greece
Colville
47.2%
MARRIED-COUPLE HOUSEHOLDS
86.0/ 100
METRIC RATING
134th/ 347
METRIC RANK
41.0%
MARRIED-COUPLE HOUSEHOLDS
0.0/ 100
METRIC RATING
311th/ 347
METRIC RANK
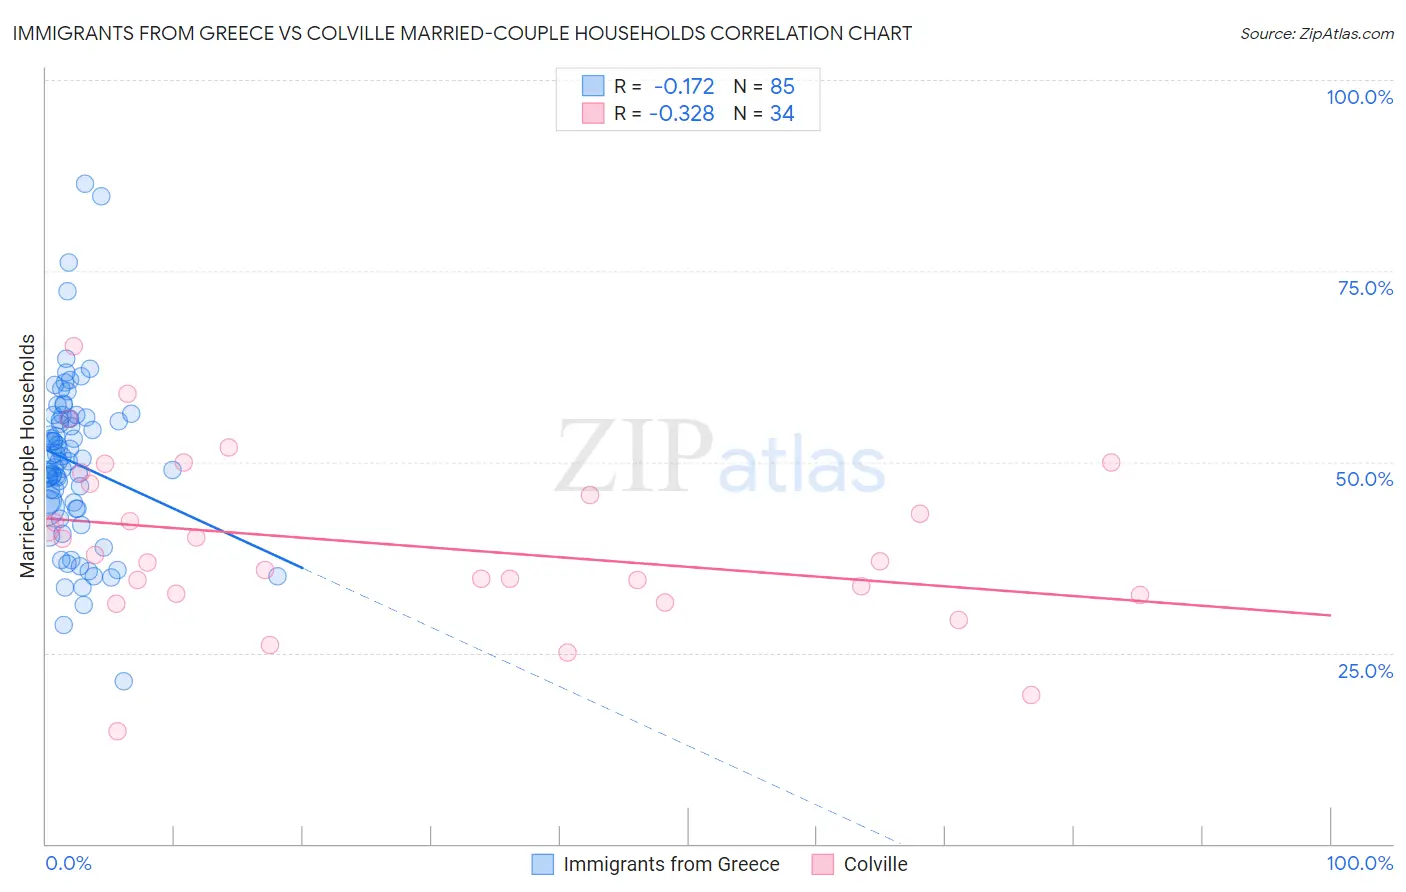
Immigrants from Greece vs Colville Married-couple Households Correlation Chart
The statistical analysis conducted on geographies consisting of 216,854,856 people shows a poor negative correlation between the proportion of Immigrants from Greece and percentage of married-couple family households in the United States with a correlation coefficient (R) of -0.172 and weighted average of 47.2%. Similarly, the statistical analysis conducted on geographies consisting of 34,682,856 people shows a mild negative correlation between the proportion of Colville and percentage of married-couple family households in the United States with a correlation coefficient (R) of -0.328 and weighted average of 41.0%, a difference of 15.3%.
Married-couple Households Correlation Summary
| Measurement | Immigrants from Greece | Colville |
| Minimum | 21.3% | 14.7% |
| Maximum | 86.4% | 65.2% |
| Range | 65.0% | 50.6% |
| Mean | 50.0% | 39.2% |
| Median | 50.1% | 37.4% |
| Interquartile 25% (IQ1) | 43.9% | 32.8% |
| Interquartile 75% (IQ3) | 55.7% | 47.2% |
| Interquartile Range (IQR) | 11.8% | 14.4% |
| Standard Deviation (Sample) | 11.0% | 10.8% |
| Standard Deviation (Population) | 10.9% | 10.7% |
Similar Demographics by Married-couple Households
Demographics Similar to Immigrants from Greece by Married-couple Households
In terms of married-couple households, the demographic groups most similar to Immigrants from Greece are Immigrants from Argentina (47.2%, a difference of 0.0%), South African (47.3%, a difference of 0.040%), New Zealander (47.2%, a difference of 0.050%), Immigrants from Ukraine (47.3%, a difference of 0.060%), and Immigrants from Malaysia (47.2%, a difference of 0.060%).
| Demographics | Rating | Rank | Married-couple Households |
| Celtics | 88.1 /100 | #127 | Excellent 47.3% |
| Immigrants | Peru | 87.9 /100 | #128 | Excellent 47.3% |
| Immigrants | Iraq | 87.8 /100 | #129 | Excellent 47.3% |
| Immigrants | Hungary | 87.8 /100 | #130 | Excellent 47.3% |
| Immigrants | Denmark | 87.5 /100 | #131 | Excellent 47.3% |
| Immigrants | Ukraine | 86.7 /100 | #132 | Excellent 47.3% |
| South Africans | 86.4 /100 | #133 | Excellent 47.3% |
| Immigrants | Greece | 86.0 /100 | #134 | Excellent 47.2% |
| Immigrants | Argentina | 86.0 /100 | #135 | Excellent 47.2% |
| New Zealanders | 85.3 /100 | #136 | Excellent 47.2% |
| Immigrants | Malaysia | 85.2 /100 | #137 | Excellent 47.2% |
| Immigrants | Afghanistan | 85.1 /100 | #138 | Excellent 47.2% |
| Immigrants | Sweden | 84.7 /100 | #139 | Excellent 47.2% |
| Spanish | 84.5 /100 | #140 | Excellent 47.2% |
| Costa Ricans | 84.4 /100 | #141 | Excellent 47.2% |
Demographics Similar to Colville by Married-couple Households
In terms of married-couple households, the demographic groups most similar to Colville are African (40.9%, a difference of 0.090%), Immigrants from Haiti (40.9%, a difference of 0.15%), Jamaican (40.9%, a difference of 0.22%), Trinidadian and Tobagonian (40.9%, a difference of 0.30%), and Immigrants from Caribbean (40.8%, a difference of 0.49%).
| Demographics | Rating | Rank | Married-couple Households |
| Immigrants | Guyana | 0.0 /100 | #304 | Tragic 41.6% |
| Sioux | 0.0 /100 | #305 | Tragic 41.5% |
| Guyanese | 0.0 /100 | #306 | Tragic 41.4% |
| Immigrants | Western Africa | 0.0 /100 | #307 | Tragic 41.4% |
| Crow | 0.0 /100 | #308 | Tragic 41.4% |
| Immigrants | Trinidad and Tobago | 0.0 /100 | #309 | Tragic 41.2% |
| Haitians | 0.0 /100 | #310 | Tragic 41.2% |
| Colville | 0.0 /100 | #311 | Tragic 41.0% |
| Africans | 0.0 /100 | #312 | Tragic 40.9% |
| Immigrants | Haiti | 0.0 /100 | #313 | Tragic 40.9% |
| Jamaicans | 0.0 /100 | #314 | Tragic 40.9% |
| Trinidadians and Tobagonians | 0.0 /100 | #315 | Tragic 40.9% |
| Immigrants | Caribbean | 0.0 /100 | #316 | Tragic 40.8% |
| Immigrants | Jamaica | 0.0 /100 | #317 | Tragic 40.7% |
| Liberians | 0.0 /100 | #318 | Tragic 40.7% |