Immigrants from Greece vs Immigrants from Jordan Married-couple Households
COMPARE
Immigrants from Greece
Immigrants from Jordan
Married-couple Households
Married-couple Households Comparison
Immigrants from Greece
Immigrants from Jordan
47.2%
MARRIED-COUPLE HOUSEHOLDS
86.0/ 100
METRIC RATING
134th/ 347
METRIC RANK
47.7%
MARRIED-COUPLE HOUSEHOLDS
94.1/ 100
METRIC RATING
109th/ 347
METRIC RANK
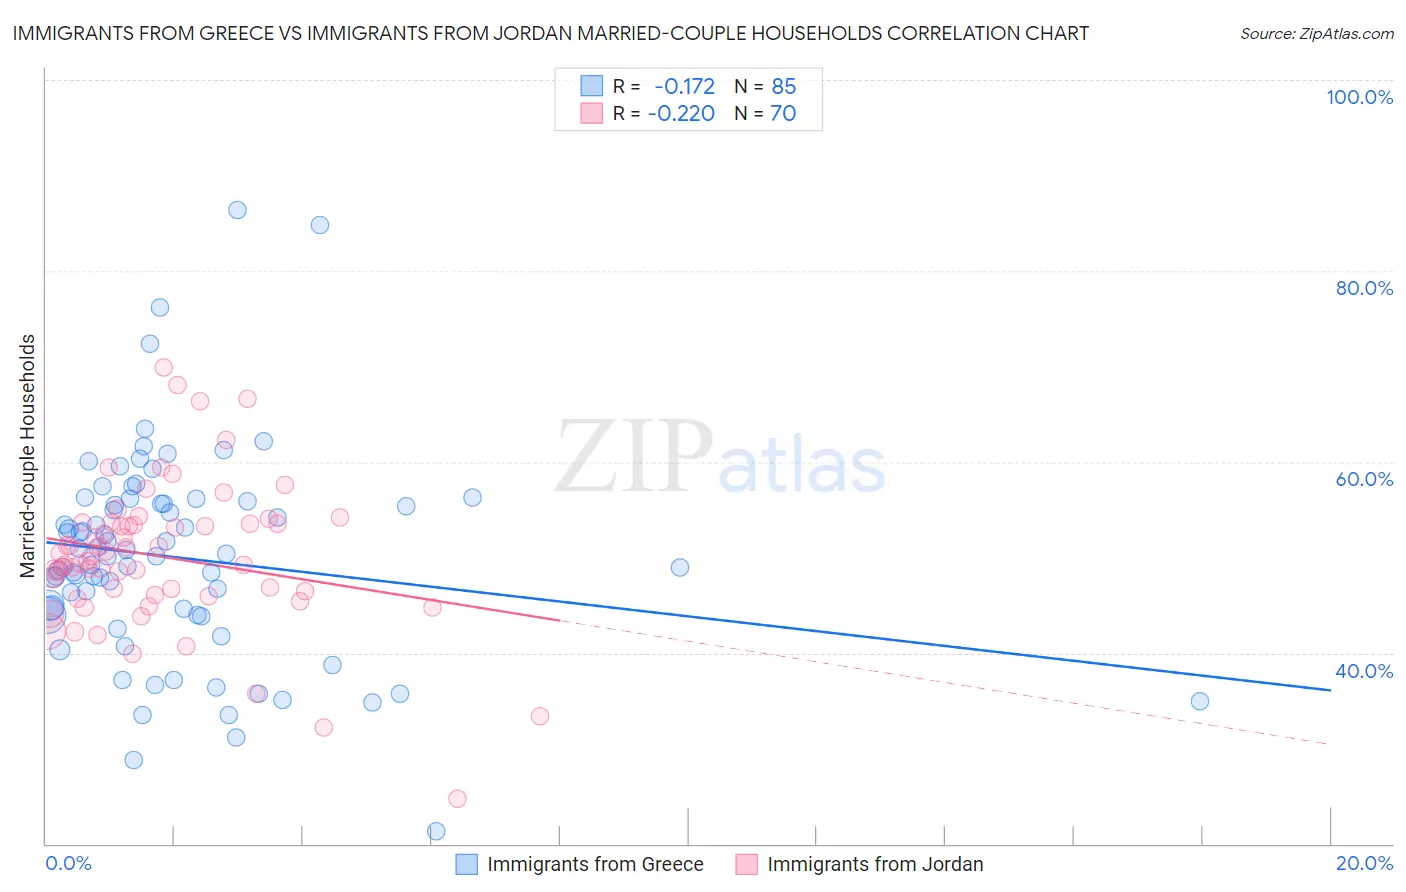
Immigrants from Greece vs Immigrants from Jordan Married-couple Households Correlation Chart
The statistical analysis conducted on geographies consisting of 216,854,856 people shows a poor negative correlation between the proportion of Immigrants from Greece and percentage of married-couple family households in the United States with a correlation coefficient (R) of -0.172 and weighted average of 47.2%. Similarly, the statistical analysis conducted on geographies consisting of 181,252,999 people shows a weak negative correlation between the proportion of Immigrants from Jordan and percentage of married-couple family households in the United States with a correlation coefficient (R) of -0.220 and weighted average of 47.7%, a difference of 0.88%.
Married-couple Households Correlation Summary
| Measurement | Immigrants from Greece | Immigrants from Jordan |
| Minimum | 21.3% | 24.7% |
| Maximum | 86.4% | 69.8% |
| Range | 65.0% | 45.1% |
| Mean | 50.0% | 50.1% |
| Median | 50.1% | 49.9% |
| Interquartile 25% (IQ1) | 43.9% | 46.0% |
| Interquartile 75% (IQ3) | 55.7% | 53.6% |
| Interquartile Range (IQR) | 11.8% | 7.5% |
| Standard Deviation (Sample) | 11.0% | 7.7% |
| Standard Deviation (Population) | 10.9% | 7.7% |
Similar Demographics by Married-couple Households
Demographics Similar to Immigrants from Greece by Married-couple Households
In terms of married-couple households, the demographic groups most similar to Immigrants from Greece are Immigrants from Argentina (47.2%, a difference of 0.0%), South African (47.3%, a difference of 0.040%), New Zealander (47.2%, a difference of 0.050%), Immigrants from Ukraine (47.3%, a difference of 0.060%), and Immigrants from Malaysia (47.2%, a difference of 0.060%).
| Demographics | Rating | Rank | Married-couple Households |
| Celtics | 88.1 /100 | #127 | Excellent 47.3% |
| Immigrants | Peru | 87.9 /100 | #128 | Excellent 47.3% |
| Immigrants | Iraq | 87.8 /100 | #129 | Excellent 47.3% |
| Immigrants | Hungary | 87.8 /100 | #130 | Excellent 47.3% |
| Immigrants | Denmark | 87.5 /100 | #131 | Excellent 47.3% |
| Immigrants | Ukraine | 86.7 /100 | #132 | Excellent 47.3% |
| South Africans | 86.4 /100 | #133 | Excellent 47.3% |
| Immigrants | Greece | 86.0 /100 | #134 | Excellent 47.2% |
| Immigrants | Argentina | 86.0 /100 | #135 | Excellent 47.2% |
| New Zealanders | 85.3 /100 | #136 | Excellent 47.2% |
| Immigrants | Malaysia | 85.2 /100 | #137 | Excellent 47.2% |
| Immigrants | Afghanistan | 85.1 /100 | #138 | Excellent 47.2% |
| Immigrants | Sweden | 84.7 /100 | #139 | Excellent 47.2% |
| Spanish | 84.5 /100 | #140 | Excellent 47.2% |
| Costa Ricans | 84.4 /100 | #141 | Excellent 47.2% |
Demographics Similar to Immigrants from Jordan by Married-couple Households
In terms of married-couple households, the demographic groups most similar to Immigrants from Jordan are Macedonian (47.6%, a difference of 0.020%), Syrian (47.6%, a difference of 0.030%), Peruvian (47.6%, a difference of 0.040%), Immigrants from Japan (47.7%, a difference of 0.050%), and Venezuelan (47.6%, a difference of 0.050%).
| Demographics | Rating | Rank | Married-couple Households |
| Slavs | 96.0 /100 | #102 | Exceptional 47.8% |
| Hawaiians | 96.0 /100 | #103 | Exceptional 47.8% |
| Immigrants | South Africa | 96.0 /100 | #104 | Exceptional 47.8% |
| Immigrants | Czechoslovakia | 95.5 /100 | #105 | Exceptional 47.8% |
| Portuguese | 95.5 /100 | #106 | Exceptional 47.8% |
| Estonians | 94.7 /100 | #107 | Exceptional 47.7% |
| Immigrants | Japan | 94.4 /100 | #108 | Exceptional 47.7% |
| Immigrants | Jordan | 94.1 /100 | #109 | Exceptional 47.7% |
| Macedonians | 93.9 /100 | #110 | Exceptional 47.6% |
| Syrians | 93.9 /100 | #111 | Exceptional 47.6% |
| Peruvians | 93.8 /100 | #112 | Exceptional 47.6% |
| Venezuelans | 93.8 /100 | #113 | Exceptional 47.6% |
| Immigrants | Europe | 93.7 /100 | #114 | Exceptional 47.6% |
| Slovaks | 92.9 /100 | #115 | Exceptional 47.6% |
| Argentineans | 92.5 /100 | #116 | Exceptional 47.5% |