Yup'ik vs Immigrants from Jordan Married-couple Households
COMPARE
Yup'ik
Immigrants from Jordan
Married-couple Households
Married-couple Households Comparison
Yup'ik
Immigrants from Jordan
44.1%
MARRIED-COUPLE HOUSEHOLDS
0.4/ 100
METRIC RATING
248th/ 347
METRIC RANK
47.7%
MARRIED-COUPLE HOUSEHOLDS
94.1/ 100
METRIC RATING
109th/ 347
METRIC RANK
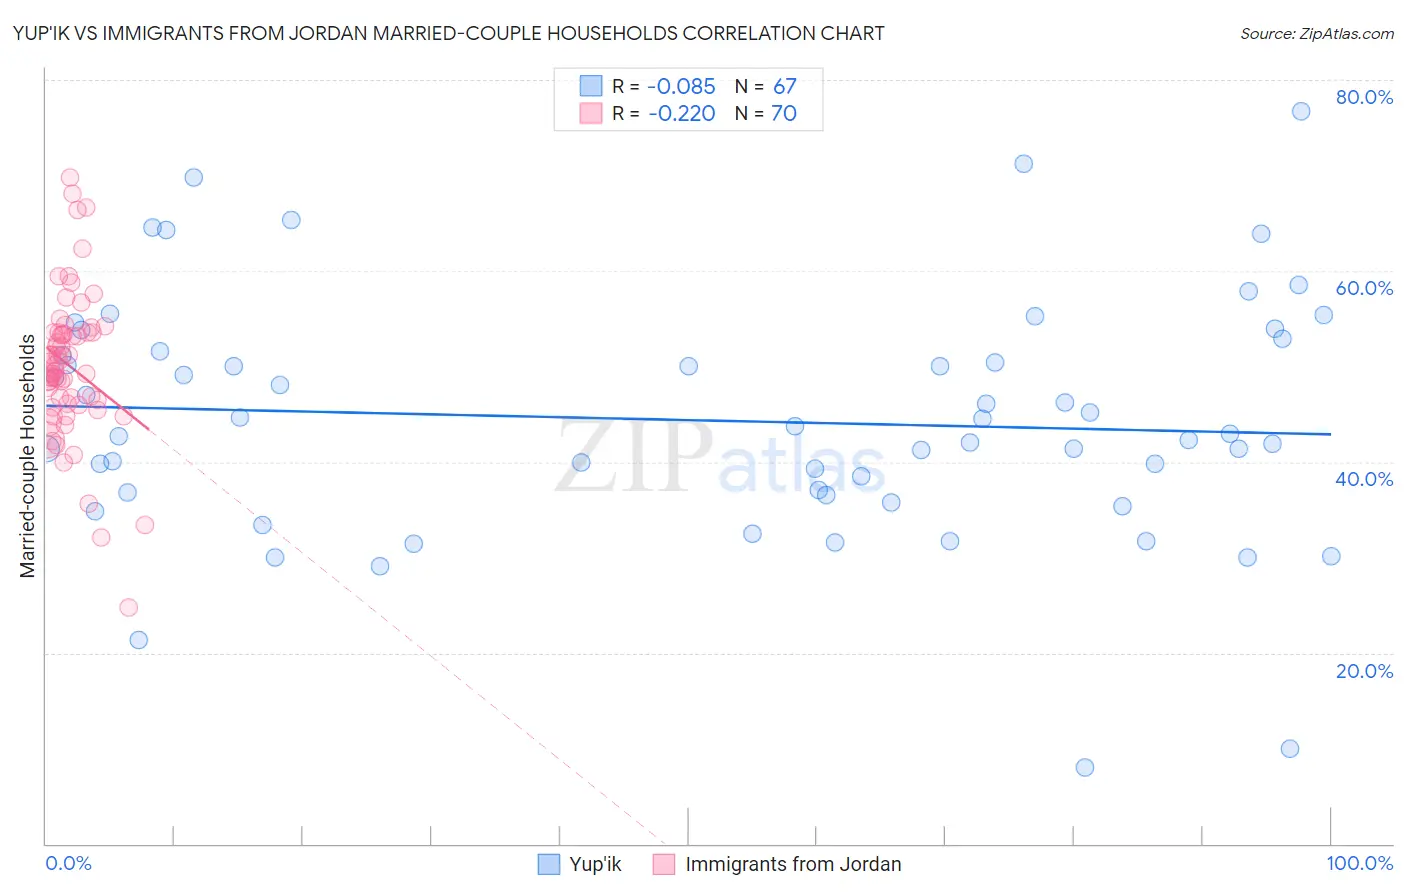
Yup'ik vs Immigrants from Jordan Married-couple Households Correlation Chart
The statistical analysis conducted on geographies consisting of 39,956,684 people shows a slight negative correlation between the proportion of Yup'ik and percentage of married-couple family households in the United States with a correlation coefficient (R) of -0.085 and weighted average of 44.1%. Similarly, the statistical analysis conducted on geographies consisting of 181,252,999 people shows a weak negative correlation between the proportion of Immigrants from Jordan and percentage of married-couple family households in the United States with a correlation coefficient (R) of -0.220 and weighted average of 47.7%, a difference of 8.1%.
Married-couple Households Correlation Summary
| Measurement | Yup'ik | Immigrants from Jordan |
| Minimum | 8.0% | 24.7% |
| Maximum | 76.7% | 69.8% |
| Range | 68.7% | 45.1% |
| Mean | 44.4% | 50.1% |
| Median | 42.9% | 49.9% |
| Interquartile 25% (IQ1) | 36.5% | 46.0% |
| Interquartile 75% (IQ3) | 51.5% | 53.6% |
| Interquartile Range (IQR) | 15.1% | 7.5% |
| Standard Deviation (Sample) | 12.8% | 7.7% |
| Standard Deviation (Population) | 12.8% | 7.7% |
Similar Demographics by Married-couple Households
Demographics Similar to Yup'ik by Married-couple Households
In terms of married-couple households, the demographic groups most similar to Yup'ik are Immigrants from Kenya (44.1%, a difference of 0.050%), French American Indian (44.1%, a difference of 0.050%), German Russian (44.0%, a difference of 0.14%), Seminole (44.0%, a difference of 0.20%), and Immigrants from Cuba (44.2%, a difference of 0.28%).
| Demographics | Rating | Rank | Married-couple Households |
| Immigrants | Bosnia and Herzegovina | 1.0 /100 | #241 | Tragic 44.4% |
| Immigrants | Albania | 1.0 /100 | #242 | Tragic 44.4% |
| Immigrants | Saudi Arabia | 0.9 /100 | #243 | Tragic 44.4% |
| Immigrants | Armenia | 0.7 /100 | #244 | Tragic 44.3% |
| Immigrants | El Salvador | 0.7 /100 | #245 | Tragic 44.3% |
| Immigrants | Cuba | 0.6 /100 | #246 | Tragic 44.2% |
| Immigrants | Morocco | 0.6 /100 | #247 | Tragic 44.2% |
| Yup'ik | 0.4 /100 | #248 | Tragic 44.1% |
| Immigrants | Kenya | 0.4 /100 | #249 | Tragic 44.1% |
| French American Indians | 0.4 /100 | #250 | Tragic 44.1% |
| German Russians | 0.4 /100 | #251 | Tragic 44.0% |
| Seminole | 0.4 /100 | #252 | Tragic 44.0% |
| Central Americans | 0.3 /100 | #253 | Tragic 43.9% |
| Apache | 0.3 /100 | #254 | Tragic 43.9% |
| Shoshone | 0.3 /100 | #255 | Tragic 43.9% |
Demographics Similar to Immigrants from Jordan by Married-couple Households
In terms of married-couple households, the demographic groups most similar to Immigrants from Jordan are Macedonian (47.6%, a difference of 0.020%), Syrian (47.6%, a difference of 0.030%), Peruvian (47.6%, a difference of 0.040%), Immigrants from Japan (47.7%, a difference of 0.050%), and Venezuelan (47.6%, a difference of 0.050%).
| Demographics | Rating | Rank | Married-couple Households |
| Slavs | 96.0 /100 | #102 | Exceptional 47.8% |
| Hawaiians | 96.0 /100 | #103 | Exceptional 47.8% |
| Immigrants | South Africa | 96.0 /100 | #104 | Exceptional 47.8% |
| Immigrants | Czechoslovakia | 95.5 /100 | #105 | Exceptional 47.8% |
| Portuguese | 95.5 /100 | #106 | Exceptional 47.8% |
| Estonians | 94.7 /100 | #107 | Exceptional 47.7% |
| Immigrants | Japan | 94.4 /100 | #108 | Exceptional 47.7% |
| Immigrants | Jordan | 94.1 /100 | #109 | Exceptional 47.7% |
| Macedonians | 93.9 /100 | #110 | Exceptional 47.6% |
| Syrians | 93.9 /100 | #111 | Exceptional 47.6% |
| Peruvians | 93.8 /100 | #112 | Exceptional 47.6% |
| Venezuelans | 93.8 /100 | #113 | Exceptional 47.6% |
| Immigrants | Europe | 93.7 /100 | #114 | Exceptional 47.6% |
| Slovaks | 92.9 /100 | #115 | Exceptional 47.6% |
| Argentineans | 92.5 /100 | #116 | Exceptional 47.5% |