European vs Immigrants from Dominica Family Households

COMPARE

European
Race
Ancestry
AfghanAfricanAlaska NativeAlaskan AthabascanAlbanianAleutAlsatianAmericanApacheArabArapahoArgentineanArmenianAssyrian/Chaldean/SyriacAustralianAustrianBahamianBangladeshiBarbadianBasqueBelgianBelizeanBermudanBhutaneseBlackfeetBolivianBrazilianBritishBritish West IndianBulgarianBurmeseCajunCambodianCanadianCape VerdeanCarpatho RusynCelticCentral AmericanCentral American IndianCherokeeCheyenneChickasawChileanChineseChippewaChoctawColombianColvilleComancheCosta RicanCreeCreekCroatianCrowCubanCypriotCzechCzechoslovakianDanishDelawareDominicanDutchDutch West IndianEastern EuropeanEcuadorianEgyptianEnglishEstonianEthiopianEuropeanFijianFilipinoFinnishFrenchFrench American IndianFrench CanadianGermanGerman RussianGhanaianGreekGuamanian/ChamorroGuatemalanGuyaneseHaitianHmongHonduranHopiHoumaHungarianIcelanderIndian (Asian)IndonesianInupiatIranianIraqiIrishIroquoisIsraeliItalianJamaicanJapaneseJordanianKenyanKiowaKoreanLaotianLatvianLebaneseLiberianLithuanianLumbeeLuxembourgerMacedonianMalaysianMalteseMarshalleseMenomineeMexicanMexican American IndianMongolianMoroccanNative HawaiianNavajoNepaleseNew ZealanderNicaraguanNigerianNorthern EuropeanNorwegianOkinawanOsageOttawaPaiutePakistaniPalestinianPanamanianParaguayanPennsylvania GermanPeruvianPimaPolishPortuguesePotawatomiPuebloPuerto RicanPuget Sound SalishRomanianRussianSalvadoranSamoanScandinavianScotch-IrishScottishSeminoleSenegaleseSerbianShoshoneSierra LeoneanSiouxSlavicSlovakSloveneSomaliSouth AfricanSouth AmericanSouth American IndianSoviet UnionSpaniardSpanishSpanish AmericanSpanish American IndianSri LankanSubsaharan AfricanSudaneseSwedishSwissSyrianTaiwaneseThaiTlingit-HaidaTohono O'OdhamTonganTrinidadian and TobagonianTsimshianTurkishU.S. Virgin IslanderUgandanUkrainianUruguayanUteVenezuelanVietnameseWelshWest IndianYakamaYaquiYugoslavianYumanYup'ikZimbabwean
Immigration
NonimmigrantsImmigrantsAfghanistanAfricaAlbaniaArgentinaArmeniaAsiaAustraliaAustriaBahamasBangladeshBarbadosBelarusBelgiumBelizeBoliviaBosnia and HerzegovinaBrazilBulgariaBurma/MyanmarCabo VerdeCambodiaCameroonCanadaCaribbeanCentral AmericaChileChinaColombiaCongoCosta RicaCroatiaCubaCzechoslovakiaDenmarkDominican RepublicEastern AfricaEastern AsiaEastern EuropeEcuadorEgyptEl SalvadorEnglandEritreaEthiopiaEuropeFijiFranceGermanyGhanaGreeceGrenadaGuatemalaGuyanaHaitiHondurasHong KongHungaryIndiaIndonesiaIranIraqIrelandIsraelItalyJamaicaJapanJordanKazakhstanKenyaKoreaKuwaitLaosLatin AmericaLatviaLebanonLiberiaLithuaniaMalaysiaMexicoMicronesiaMiddle AfricaMoldovaMoroccoNepalNetherlandsNicaraguaNigeriaNorth AmericaNorth MacedoniaNorthern AfricaNorthern EuropeNorwayOceaniaPakistanPanamaPeruPhilippinesPolandPortugalRomaniaRussiaSaudi ArabiaScotlandSenegalSerbiaSierra LeoneSingaporeSomaliaSouth AfricaSouth AmericaSouth Central AsiaSouth Eastern AsiaSouthern EuropeSpainSri LankaSt. Vincent and the GrenadinesSudanSwedenSwitzerlandSyriaTaiwanThailandTrinidad and TobagoTurkeyUgandaUkraineUruguayUzbekistanVenezuelaVietnamWest IndiesWestern AfricaWestern AsiaWestern EuropeYemenZaireZimbabweAzores
Immigrants from Dominica
Race
Ancestry
AfghanAfricanAlaska NativeAlaskan AthabascanAlbanianAleutAlsatianAmericanApacheArabArapahoArgentineanArmenianAssyrian/Chaldean/SyriacAustralianAustrianBahamianBangladeshiBarbadianBasqueBelgianBelizeanBermudanBhutaneseBlackfeetBolivianBrazilianBritishBritish West IndianBulgarianBurmeseCajunCambodianCanadianCape VerdeanCarpatho RusynCelticCentral AmericanCentral American IndianCherokeeCheyenneChickasawChileanChineseChippewaChoctawColombianColvilleComancheCosta RicanCreeCreekCroatianCrowCubanCypriotCzechCzechoslovakianDanishDelawareDominicanDutchDutch West IndianEastern EuropeanEcuadorianEgyptianEnglishEstonianEthiopianFijianFilipinoFinnishFrenchFrench American IndianFrench CanadianGermanGerman RussianGhanaianGreekGuamanian/ChamorroGuatemalanGuyaneseHaitianHmongHonduranHopiHoumaHungarianIcelanderIndian (Asian)IndonesianInupiatIranianIraqiIrishIroquoisIsraeliItalianJamaicanJapaneseJordanianKenyanKiowaKoreanLaotianLatvianLebaneseLiberianLithuanianLumbeeLuxembourgerMacedonianMalaysianMalteseMarshalleseMenomineeMexicanMexican American IndianMongolianMoroccanNative HawaiianNavajoNepaleseNew ZealanderNicaraguanNigerianNorthern EuropeanNorwegianOkinawanOsageOttawaPaiutePakistaniPalestinianPanamanianParaguayanPennsylvania GermanPeruvianPimaPolishPortuguesePotawatomiPuebloPuerto RicanPuget Sound SalishRomanianRussianSalvadoranSamoanScandinavianScotch-IrishScottishSeminoleSenegaleseSerbianShoshoneSierra LeoneanSiouxSlavicSlovakSloveneSomaliSouth AfricanSouth AmericanSouth American IndianSoviet UnionSpaniardSpanishSpanish AmericanSpanish American IndianSri LankanSubsaharan AfricanSudaneseSwedishSwissSyrianTaiwaneseThaiTlingit-HaidaTohono O'OdhamTonganTrinidadian and TobagonianTsimshianTurkishU.S. Virgin IslanderUgandanUkrainianUruguayanUteVenezuelanVietnameseWelshWest IndianYakamaYaquiYugoslavianYumanYup'ikZimbabwean
Immigration
NonimmigrantsImmigrantsAfghanistanAfricaAlbaniaArgentinaArmeniaAsiaAustraliaAustriaBahamasBangladeshBarbadosBelarusBelgiumBelizeBoliviaBosnia and HerzegovinaBrazilBulgariaBurma/MyanmarCabo VerdeCambodiaCameroonCanadaCaribbeanCentral AmericaChileChinaColombiaCongoCosta RicaCroatiaCubaCzechoslovakiaDenmarkDominicaDominican RepublicEastern AfricaEastern AsiaEastern EuropeEcuadorEgyptEl SalvadorEnglandEritreaEthiopiaEuropeFijiFranceGermanyGhanaGreeceGrenadaGuatemalaGuyanaHaitiHondurasHong KongHungaryIndiaIndonesiaIranIraqIrelandIsraelItalyJamaicaJapanJordanKazakhstanKenyaKoreaKuwaitLaosLatin AmericaLatviaLebanonLiberiaLithuaniaMalaysiaMexicoMicronesiaMiddle AfricaMoldovaMoroccoNepalNetherlandsNicaraguaNigeriaNorth AmericaNorth MacedoniaNorthern AfricaNorthern EuropeNorwayOceaniaPakistanPanamaPeruPhilippinesPolandPortugalRomaniaRussiaSaudi ArabiaScotlandSenegalSerbiaSierra LeoneSingaporeSomaliaSouth AfricaSouth AmericaSouth Central AsiaSouth Eastern AsiaSouthern EuropeSpainSri LankaSt. Vincent and the GrenadinesSudanSwedenSwitzerlandSyriaTaiwanThailandTrinidad and TobagoTurkeyUgandaUkraineUruguayUzbekistanVenezuelaVietnamWest IndiesWestern AfricaWestern AsiaWestern EuropeYemenZaireZimbabweAzores
Family Households
Income
Poverty
Unemployment
Labor Participation
Family Structure
Vehicle Availability
Education Level
Disability

Family Households Comparison

Europeans

Immigrants from Dominica

Exceptional
Tragic
65.0%
FAMILY HOUSEHOLDS
96.8/ 100
METRIC RATING
111th/ 347
METRIC RANK
63.4%
FAMILY HOUSEHOLDS
1.6/ 100
METRIC RATING
245th/ 347
METRIC RANK

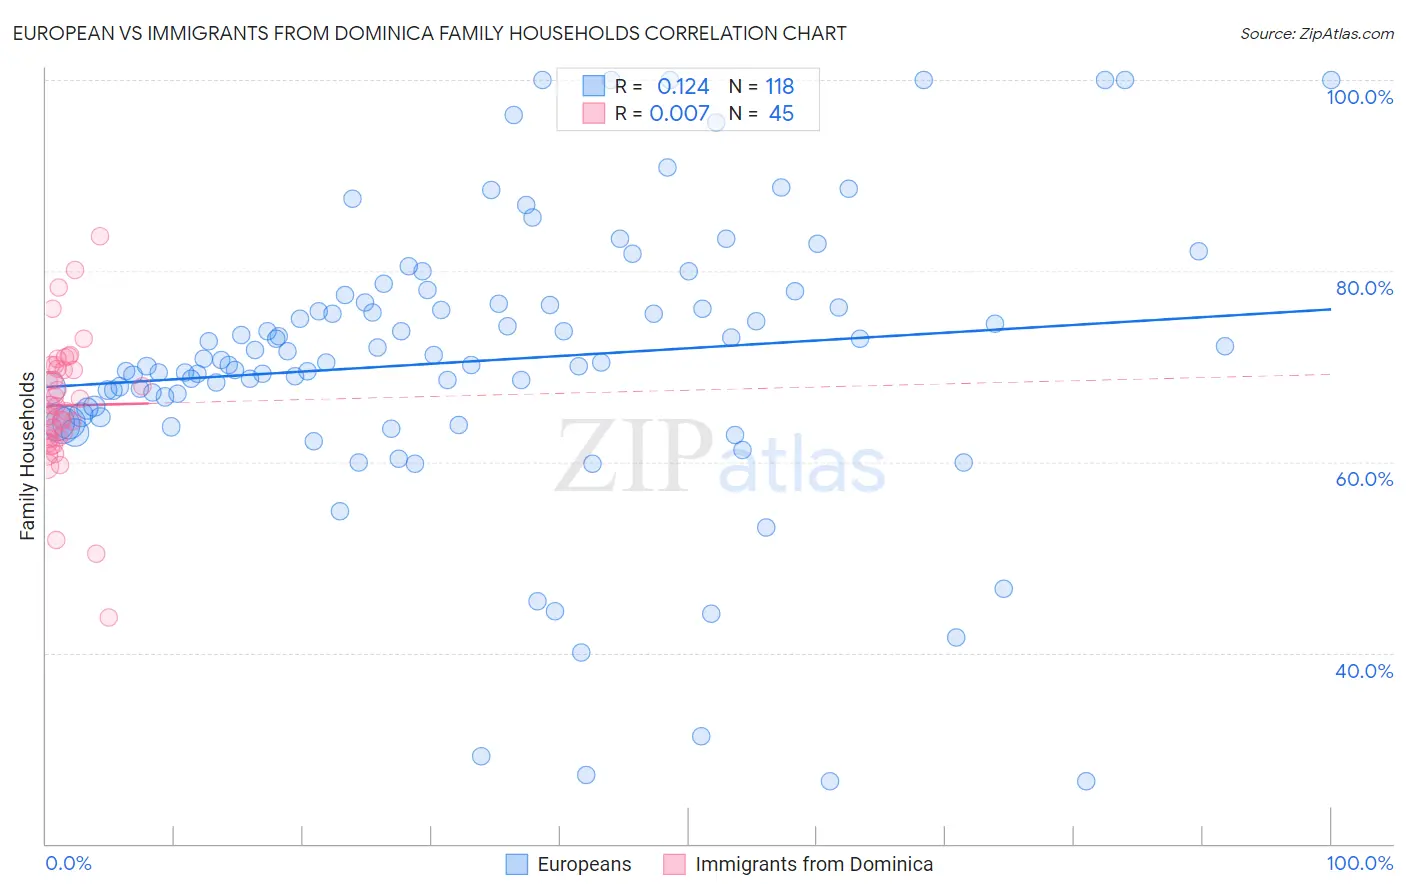
European vs Immigrants from Dominica Family Households Correlation Chart

The statistical analysis conducted on geographies consisting of 561,245,057 people shows a poor positive correlation between the proportion of Europeans and percentage of family households in the United States with a correlation coefficient (R) of 0.124 and weighted average of 65.0%. Similarly, the statistical analysis conducted on geographies consisting of 83,778,248 people shows no correlation between the proportion of Immigrants from Dominica and percentage of family households in the United States with a correlation coefficient (R) of 0.007 and weighted average of 63.4%, a difference of 2.6%.
European vs Immigrants from Dominica Family Households

Family Households Correlation Summary

MeasurementEuropeanImmigrants from Dominica
Minimum26.5%43.8%
Maximum100.0%83.7%
Range73.5%39.9%
Mean70.5%65.9%
Median70.4%65.8%
Interquartile 25% (IQ1)65.0%62.5%
Interquartile 75% (IQ3)76.5%69.9%
Interquartile Range (IQR)11.6%7.5%
Standard Deviation (Sample)15.0%7.1%
Standard Deviation (Population)15.0%7.0%

Similar Demographics by Family Households

Demographics Similar to Europeans by Family Households

In terms of family households, the demographic groups most similar to Europeans are Scandinavian (65.0%, a difference of 0.0%), Immigrants from Guatemala (65.0%, a difference of 0.010%), Immigrants from Jordan (65.0%, a difference of 0.030%), Palestinian (65.1%, a difference of 0.050%), and Alaska Native (65.1%, a difference of 0.060%).
DemographicsRating | RankFamily Households
Spaniards
97.8
/100
|
#104
Exceptional
65.1%
English
97.4
/100
|
#105
Exceptional
65.1%
Whites/Caucasians
97.3
/100
|
#106
Exceptional
65.1%
Alaska Natives
97.3
/100
|
#107
Exceptional
65.1%
Palestinians
97.2
/100
|
#108
Exceptional
65.1%
Immigrants | Guatemala
96.9
/100
|
#109
Exceptional
65.0%
Scandinavians
96.8
/100
|
#110
Exceptional
65.0%
Europeans
96.8
/100
|
#111
Exceptional
65.0%
Immigrants | Jordan
96.5
/100
|
#112
Exceptional
65.0%
Spanish
96.2
/100
|
#113
Exceptional
65.0%
Argentineans
95.7
/100
|
#114
Exceptional
65.0%
Ecuadorians
95.4
/100
|
#115
Exceptional
65.0%
Immigrants | Iraq
95.4
/100
|
#116
Exceptional
65.0%
Cherokee
95.3
/100
|
#117
Exceptional
65.0%
Dutch
95.1
/100
|
#118
Exceptional
64.9%

Demographics Similar to Immigrants from Dominica by Family Households

In terms of family households, the demographic groups most similar to Immigrants from Dominica are Eastern European (63.4%, a difference of 0.0%), Immigrants from Ghana (63.4%, a difference of 0.020%), Immigrants from Czechoslovakia (63.4%, a difference of 0.030%), Immigrants from Uzbekistan (63.4%, a difference of 0.030%), and Immigrants from Israel (63.4%, a difference of 0.040%).
DemographicsRating | RankFamily Households
Immigrants | Zimbabwe
2.0
/100
|
#238
Tragic
63.5%
Aleuts
1.9
/100
|
#239
Tragic
63.4%
South Africans
1.9
/100
|
#240
Tragic
63.4%
Immigrants | St. Vincent and the Grenadines
1.9
/100
|
#241
Tragic
63.4%
Immigrants | Israel
1.8
/100
|
#242
Tragic
63.4%
Immigrants | Czechoslovakia
1.8
/100
|
#243
Tragic
63.4%
Eastern Europeans
1.6
/100
|
#244
Tragic
63.4%
Immigrants | Dominica
1.6
/100
|
#245
Tragic
63.4%
Immigrants | Ghana
1.6
/100
|
#246
Tragic
63.4%
Immigrants | Uzbekistan
1.5
/100
|
#247
Tragic
63.4%
Dominicans
1.5
/100
|
#248
Tragic
63.4%
Russians
1.4
/100
|
#249
Tragic
63.4%
Immigrants | Japan
1.4
/100
|
#250
Tragic
63.4%
Taiwanese
1.2
/100
|
#251
Tragic
63.3%
Bahamians
1.1
/100
|
#252
Tragic
63.3%