Canadian vs Immigrants from Dominica Family Households
COMPARE
Canadian
Immigrants from Dominica
Family Households
Family Households Comparison
Canadians
Immigrants from Dominica
64.4%
FAMILY HOUSEHOLDS
66.6/ 100
METRIC RATING
157th/ 347
METRIC RANK
63.4%
FAMILY HOUSEHOLDS
1.6/ 100
METRIC RATING
245th/ 347
METRIC RANK
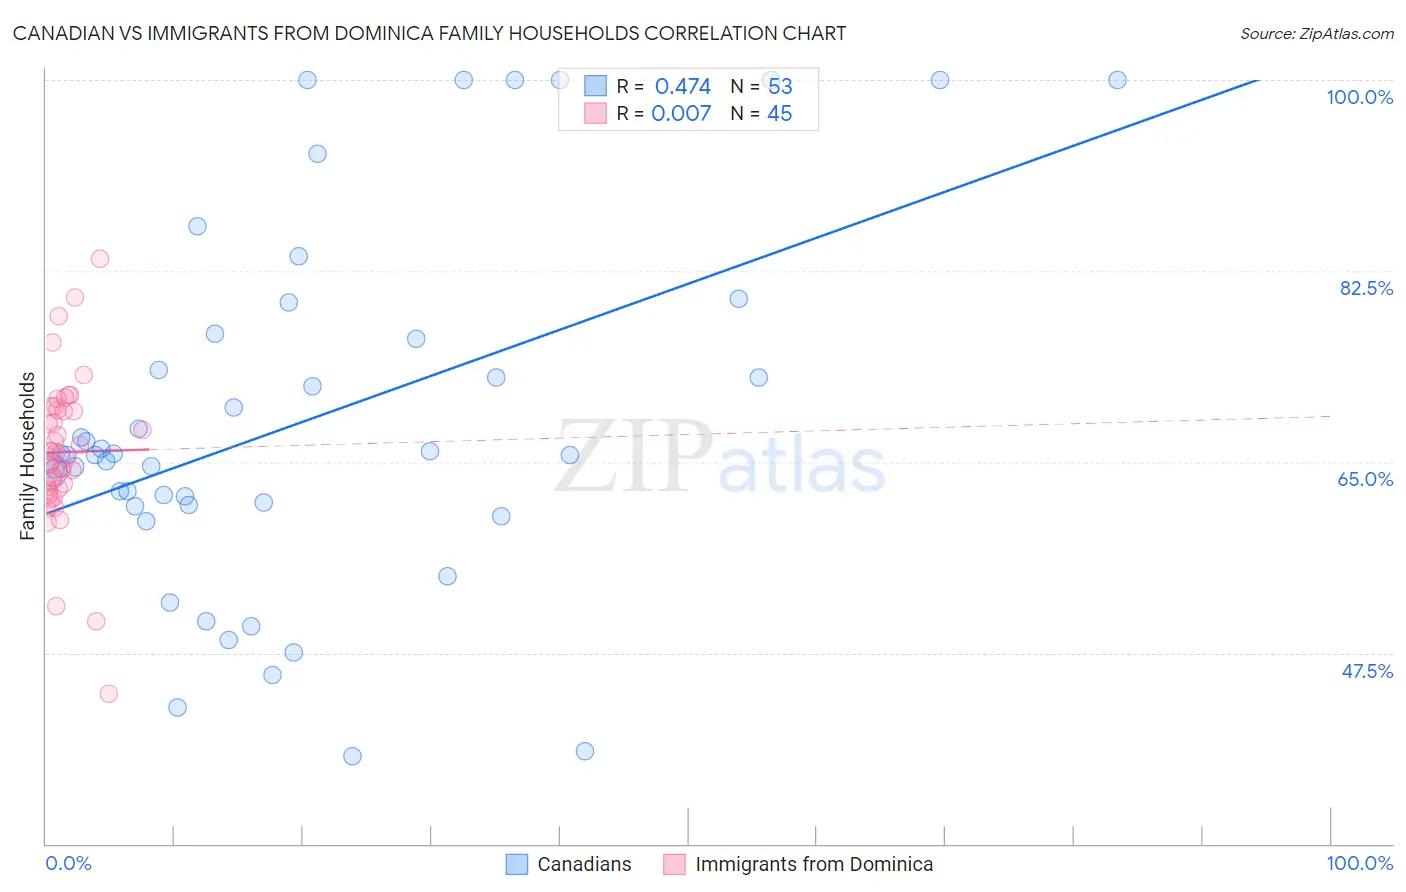
Canadian vs Immigrants from Dominica Family Households Correlation Chart
The statistical analysis conducted on geographies consisting of 437,288,954 people shows a moderate positive correlation between the proportion of Canadians and percentage of family households in the United States with a correlation coefficient (R) of 0.474 and weighted average of 64.4%. Similarly, the statistical analysis conducted on geographies consisting of 83,778,248 people shows no correlation between the proportion of Immigrants from Dominica and percentage of family households in the United States with a correlation coefficient (R) of 0.007 and weighted average of 63.4%, a difference of 1.6%.
Family Households Correlation Summary
| Measurement | Canadian | Immigrants from Dominica |
| Minimum | 38.0% | 43.8% |
| Maximum | 100.0% | 83.7% |
| Range | 62.0% | 39.9% |
| Mean | 68.7% | 65.9% |
| Median | 65.6% | 65.8% |
| Interquartile 25% (IQ1) | 61.0% | 62.5% |
| Interquartile 75% (IQ3) | 76.5% | 69.9% |
| Interquartile Range (IQR) | 15.5% | 7.5% |
| Standard Deviation (Sample) | 16.5% | 7.1% |
| Standard Deviation (Population) | 16.4% | 7.0% |
Similar Demographics by Family Households
Demographics Similar to Canadians by Family Households
In terms of family households, the demographic groups most similar to Canadians are Lebanese (64.4%, a difference of 0.0%), Czech (64.5%, a difference of 0.010%), German (64.4%, a difference of 0.010%), Uruguayan (64.5%, a difference of 0.020%), and Immigrants from Moldova (64.4%, a difference of 0.020%).
| Demographics | Rating | Rank | Family Households |
| Romanians | 75.3 /100 | #150 | Good 64.5% |
| Syrians | 75.2 /100 | #151 | Good 64.5% |
| Scottish | 70.9 /100 | #152 | Good 64.5% |
| Swedes | 69.8 /100 | #153 | Good 64.5% |
| Austrians | 68.5 /100 | #154 | Good 64.5% |
| Uruguayans | 67.7 /100 | #155 | Good 64.5% |
| Czechs | 67.0 /100 | #156 | Good 64.5% |
| Canadians | 66.6 /100 | #157 | Good 64.4% |
| Lebanese | 66.4 /100 | #158 | Good 64.4% |
| Germans | 65.8 /100 | #159 | Good 64.4% |
| Immigrants | Moldova | 65.2 /100 | #160 | Good 64.4% |
| Immigrants | England | 62.6 /100 | #161 | Good 64.4% |
| British | 61.6 /100 | #162 | Good 64.4% |
| Chickasaw | 61.5 /100 | #163 | Good 64.4% |
| Immigrants | Nigeria | 60.1 /100 | #164 | Good 64.4% |
Demographics Similar to Immigrants from Dominica by Family Households
In terms of family households, the demographic groups most similar to Immigrants from Dominica are Eastern European (63.4%, a difference of 0.0%), Immigrants from Ghana (63.4%, a difference of 0.020%), Immigrants from Czechoslovakia (63.4%, a difference of 0.030%), Immigrants from Uzbekistan (63.4%, a difference of 0.030%), and Immigrants from Israel (63.4%, a difference of 0.040%).
| Demographics | Rating | Rank | Family Households |
| Immigrants | Zimbabwe | 2.0 /100 | #238 | Tragic 63.5% |
| Aleuts | 1.9 /100 | #239 | Tragic 63.4% |
| South Africans | 1.9 /100 | #240 | Tragic 63.4% |
| Immigrants | St. Vincent and the Grenadines | 1.9 /100 | #241 | Tragic 63.4% |
| Immigrants | Israel | 1.8 /100 | #242 | Tragic 63.4% |
| Immigrants | Czechoslovakia | 1.8 /100 | #243 | Tragic 63.4% |
| Eastern Europeans | 1.6 /100 | #244 | Tragic 63.4% |
| Immigrants | Dominica | 1.6 /100 | #245 | Tragic 63.4% |
| Immigrants | Ghana | 1.6 /100 | #246 | Tragic 63.4% |
| Immigrants | Uzbekistan | 1.5 /100 | #247 | Tragic 63.4% |
| Dominicans | 1.5 /100 | #248 | Tragic 63.4% |
| Russians | 1.4 /100 | #249 | Tragic 63.4% |
| Immigrants | Japan | 1.4 /100 | #250 | Tragic 63.4% |
| Taiwanese | 1.2 /100 | #251 | Tragic 63.3% |
| Bahamians | 1.1 /100 | #252 | Tragic 63.3% |