Eastern European vs Osage Married-couple Households
COMPARE
Eastern European
Osage
Married-couple Households
Married-couple Households Comparison
Eastern Europeans
Osage
48.6%
MARRIED-COUPLE HOUSEHOLDS
99.3/ 100
METRIC RATING
51st/ 347
METRIC RANK
46.9%
MARRIED-COUPLE HOUSEHOLDS
73.2/ 100
METRIC RATING
159th/ 347
METRIC RANK
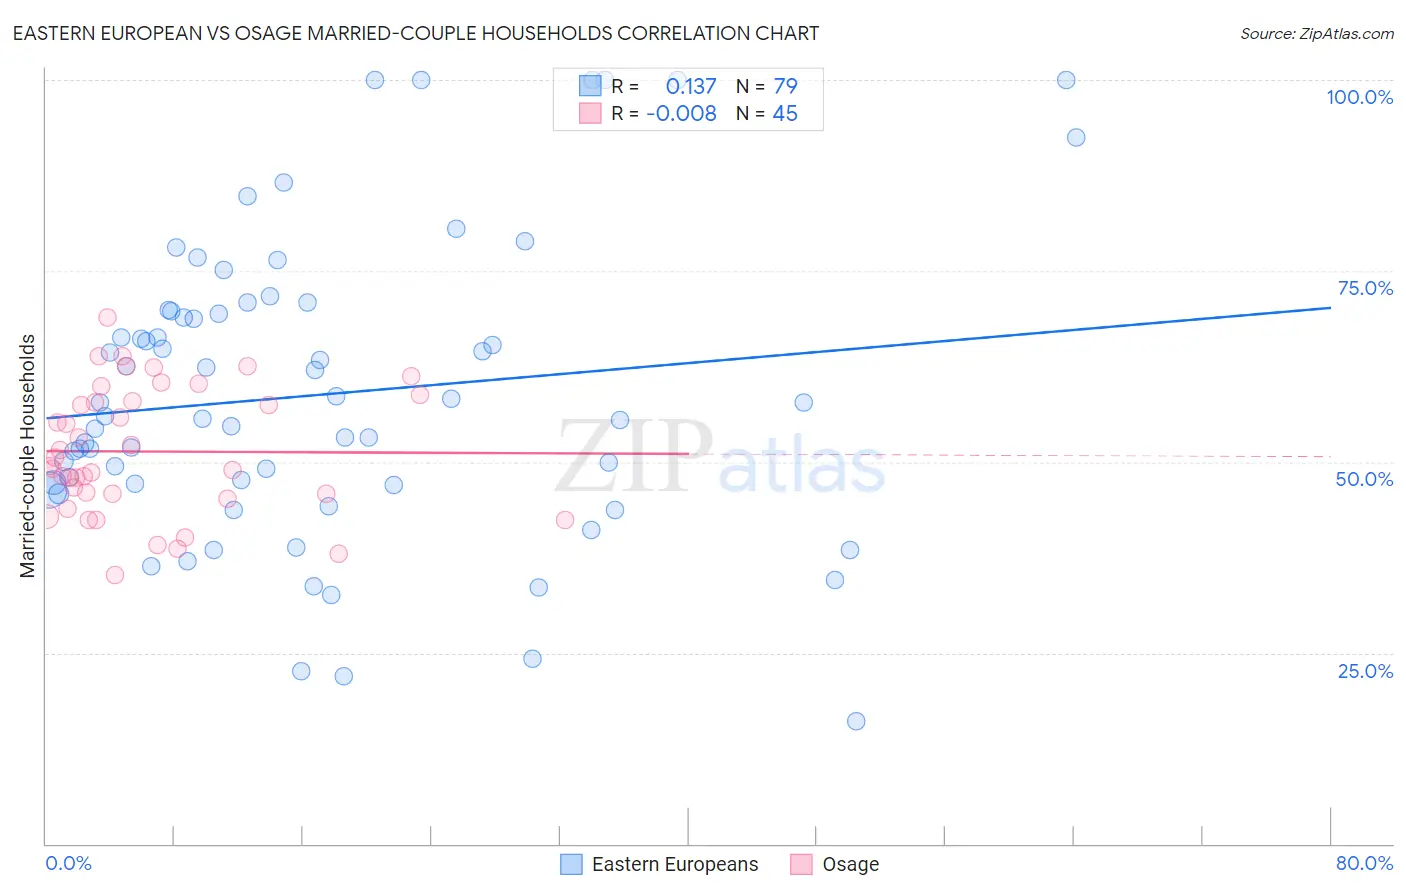
Eastern European vs Osage Married-couple Households Correlation Chart
The statistical analysis conducted on geographies consisting of 460,944,660 people shows a poor positive correlation between the proportion of Eastern Europeans and percentage of married-couple family households in the United States with a correlation coefficient (R) of 0.137 and weighted average of 48.6%. Similarly, the statistical analysis conducted on geographies consisting of 91,797,548 people shows no correlation between the proportion of Osage and percentage of married-couple family households in the United States with a correlation coefficient (R) of -0.008 and weighted average of 46.9%, a difference of 3.7%.
Married-couple Households Correlation Summary
| Measurement | Eastern European | Osage |
| Minimum | 16.0% | 35.1% |
| Maximum | 100.0% | 68.9% |
| Range | 84.0% | 33.8% |
| Mean | 58.8% | 51.3% |
| Median | 55.9% | 49.4% |
| Interquartile 25% (IQ1) | 47.0% | 45.5% |
| Interquartile 75% (IQ3) | 69.8% | 58.3% |
| Interquartile Range (IQR) | 22.8% | 12.9% |
| Standard Deviation (Sample) | 19.4% | 8.3% |
| Standard Deviation (Population) | 19.3% | 8.2% |
Similar Demographics by Married-couple Households
Demographics Similar to Eastern Europeans by Married-couple Households
In terms of married-couple households, the demographic groups most similar to Eastern Europeans are Samoan (48.7%, a difference of 0.040%), Irish (48.6%, a difference of 0.040%), Immigrants from Sri Lanka (48.7%, a difference of 0.080%), White/Caucasian (48.6%, a difference of 0.090%), and Immigrants from Lithuania (48.6%, a difference of 0.090%).
| Demographics | Rating | Rank | Married-couple Households |
| Welsh | 99.5 /100 | #44 | Exceptional 48.8% |
| Immigrants | Eastern Asia | 99.5 /100 | #45 | Exceptional 48.8% |
| Tsimshian | 99.5 /100 | #46 | Exceptional 48.7% |
| British | 99.5 /100 | #47 | Exceptional 48.7% |
| Indians (Asian) | 99.4 /100 | #48 | Exceptional 48.7% |
| Immigrants | Sri Lanka | 99.4 /100 | #49 | Exceptional 48.7% |
| Samoans | 99.4 /100 | #50 | Exceptional 48.7% |
| Eastern Europeans | 99.3 /100 | #51 | Exceptional 48.6% |
| Irish | 99.3 /100 | #52 | Exceptional 48.6% |
| Whites/Caucasians | 99.3 /100 | #53 | Exceptional 48.6% |
| Immigrants | Lithuania | 99.3 /100 | #54 | Exceptional 48.6% |
| Austrians | 99.3 /100 | #55 | Exceptional 48.6% |
| Immigrants | Northern Europe | 99.3 /100 | #56 | Exceptional 48.6% |
| Poles | 99.2 /100 | #57 | Exceptional 48.5% |
| Immigrants | Indonesia | 99.2 /100 | #58 | Exceptional 48.5% |
Demographics Similar to Osage by Married-couple Households
In terms of married-couple households, the demographic groups most similar to Osage are Nonimmigrants (46.9%, a difference of 0.0%), Iraqi (46.9%, a difference of 0.070%), Immigrants from Oceania (46.9%, a difference of 0.080%), Delaware (46.8%, a difference of 0.090%), and Armenian (46.9%, a difference of 0.10%).
| Demographics | Rating | Rank | Married-couple Households |
| Serbians | 76.3 /100 | #152 | Good 47.0% |
| Hmong | 76.2 /100 | #153 | Good 47.0% |
| Immigrants | Western Asia | 76.1 /100 | #154 | Good 46.9% |
| Arabs | 76.0 /100 | #155 | Good 46.9% |
| Armenians | 75.4 /100 | #156 | Good 46.9% |
| Immigrants | Oceania | 74.8 /100 | #157 | Good 46.9% |
| Immigrants | Nonimmigrants | 73.3 /100 | #158 | Good 46.9% |
| Osage | 73.2 /100 | #159 | Good 46.9% |
| Iraqis | 71.7 /100 | #160 | Good 46.9% |
| Delaware | 71.2 /100 | #161 | Good 46.8% |
| Colombians | 71.0 /100 | #162 | Good 46.8% |
| Immigrants | Turkey | 70.2 /100 | #163 | Good 46.8% |
| Immigrants | Kazakhstan | 70.0 /100 | #164 | Good 46.8% |
| Immigrants | Southern Europe | 69.9 /100 | #165 | Good 46.8% |
| Cherokee | 65.7 /100 | #166 | Good 46.7% |