Danish vs Immigrants from Middle Africa Family Households
COMPARE
Danish
Immigrants from Middle Africa
Family Households
Family Households Comparison
Danes
Immigrants from Middle Africa
66.0%
FAMILY HOUSEHOLDS
100.0/ 100
METRIC RATING
61st/ 347
METRIC RANK
61.9%
FAMILY HOUSEHOLDS
0.0/ 100
METRIC RATING
316th/ 347
METRIC RANK
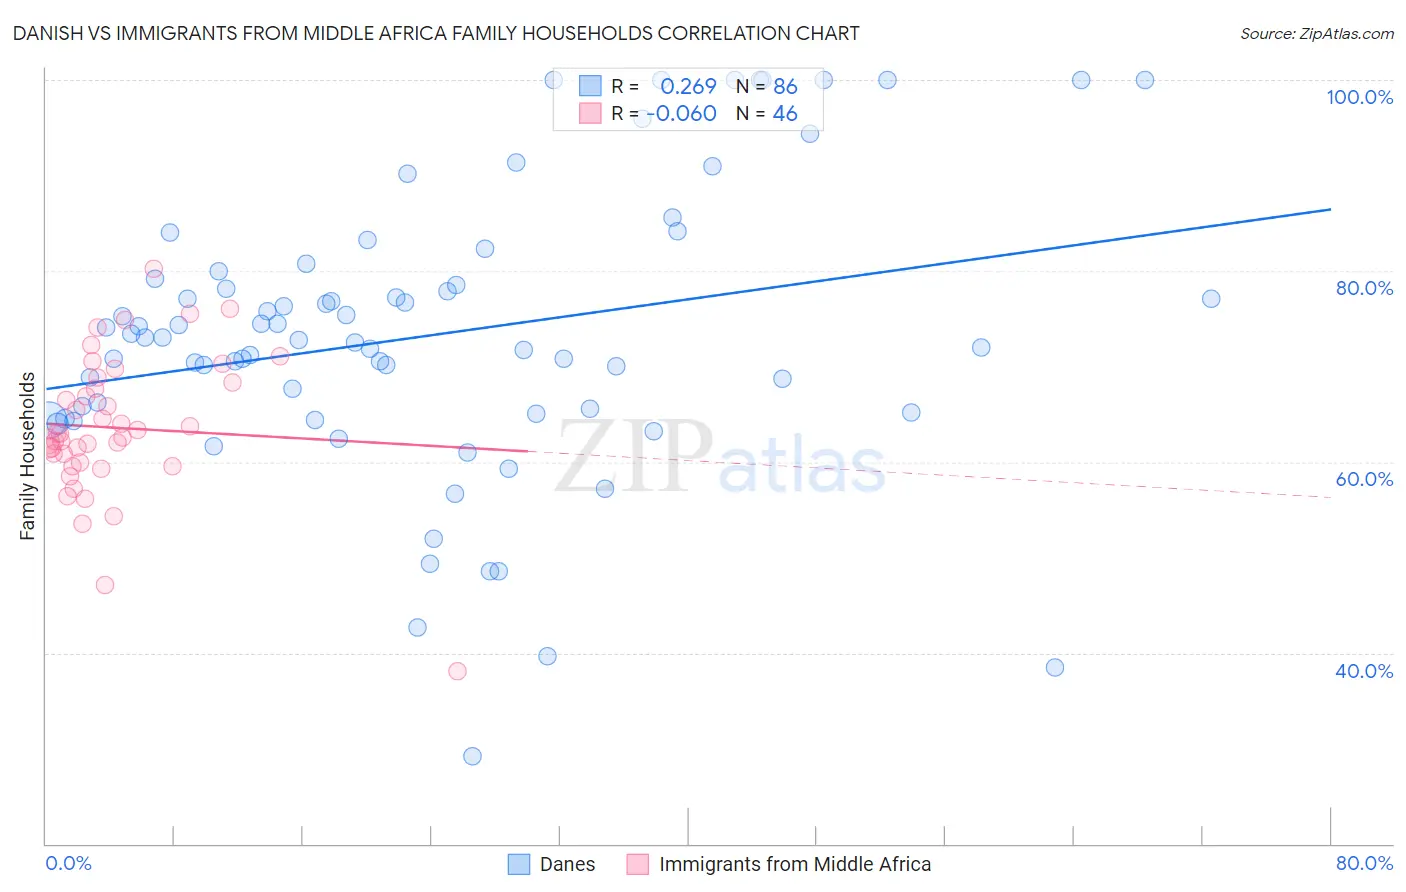
Danish vs Immigrants from Middle Africa Family Households Correlation Chart
The statistical analysis conducted on geographies consisting of 473,910,388 people shows a weak positive correlation between the proportion of Danes and percentage of family households in the United States with a correlation coefficient (R) of 0.269 and weighted average of 66.0%. Similarly, the statistical analysis conducted on geographies consisting of 202,657,833 people shows a slight negative correlation between the proportion of Immigrants from Middle Africa and percentage of family households in the United States with a correlation coefficient (R) of -0.060 and weighted average of 61.9%, a difference of 6.7%.
Family Households Correlation Summary
| Measurement | Danish | Immigrants from Middle Africa |
| Minimum | 29.2% | 38.1% |
| Maximum | 100.0% | 80.2% |
| Range | 70.8% | 42.1% |
| Mean | 73.3% | 63.6% |
| Median | 72.9% | 62.7% |
| Interquartile 25% (IQ1) | 65.2% | 60.0% |
| Interquartile 75% (IQ3) | 79.2% | 68.3% |
| Interquartile Range (IQR) | 14.0% | 8.4% |
| Standard Deviation (Sample) | 14.9% | 7.5% |
| Standard Deviation (Population) | 14.8% | 7.5% |
Similar Demographics by Family Households
Demographics Similar to Danes by Family Households
In terms of family households, the demographic groups most similar to Danes are South American (66.0%, a difference of 0.020%), Immigrants from Korea (66.0%, a difference of 0.030%), Central American (66.0%, a difference of 0.030%), Immigrants from Asia (66.1%, a difference of 0.050%), and Immigrants from Indonesia (66.0%, a difference of 0.070%).
| Demographics | Rating | Rank | Family Households |
| Immigrants | Colombia | 100.0 /100 | #54 | Exceptional 66.3% |
| Immigrants | Immigrants | 100.0 /100 | #55 | Exceptional 66.1% |
| Immigrants | Hong Kong | 100.0 /100 | #56 | Exceptional 66.1% |
| Pennsylvania Germans | 100.0 /100 | #57 | Exceptional 66.1% |
| Immigrants | Asia | 100.0 /100 | #58 | Exceptional 66.1% |
| Immigrants | Korea | 100.0 /100 | #59 | Exceptional 66.0% |
| South Americans | 100.0 /100 | #60 | Exceptional 66.0% |
| Danes | 100.0 /100 | #61 | Exceptional 66.0% |
| Central Americans | 100.0 /100 | #62 | Exceptional 66.0% |
| Immigrants | Indonesia | 100.0 /100 | #63 | Exceptional 66.0% |
| Pima | 99.9 /100 | #64 | Exceptional 65.9% |
| Costa Ricans | 99.9 /100 | #65 | Exceptional 65.9% |
| Fijians | 99.9 /100 | #66 | Exceptional 65.9% |
| Filipinos | 99.9 /100 | #67 | Exceptional 65.9% |
| Japanese | 99.9 /100 | #68 | Exceptional 65.9% |
Demographics Similar to Immigrants from Middle Africa by Family Households
In terms of family households, the demographic groups most similar to Immigrants from Middle Africa are Moroccan (61.9%, a difference of 0.040%), Immigrants from Bosnia and Herzegovina (61.9%, a difference of 0.040%), Immigrants from Cabo Verde (61.9%, a difference of 0.080%), Alaskan Athabascan (61.8%, a difference of 0.12%), and Liberian (62.0%, a difference of 0.13%).
| Demographics | Rating | Rank | Family Households |
| Sub-Saharan Africans | 0.0 /100 | #309 | Tragic 62.1% |
| Immigrants | Liberia | 0.0 /100 | #310 | Tragic 62.0% |
| Immigrants | Morocco | 0.0 /100 | #311 | Tragic 62.0% |
| Immigrants | Latvia | 0.0 /100 | #312 | Tragic 62.0% |
| Liberians | 0.0 /100 | #313 | Tragic 62.0% |
| Immigrants | Cabo Verde | 0.0 /100 | #314 | Tragic 61.9% |
| Moroccans | 0.0 /100 | #315 | Tragic 61.9% |
| Immigrants | Middle Africa | 0.0 /100 | #316 | Tragic 61.9% |
| Immigrants | Bosnia and Herzegovina | 0.0 /100 | #317 | Tragic 61.9% |
| Alaskan Athabascans | 0.0 /100 | #318 | Tragic 61.8% |
| Cape Verdeans | 0.0 /100 | #319 | Tragic 61.8% |
| Ugandans | 0.0 /100 | #320 | Tragic 61.7% |
| Alsatians | 0.0 /100 | #321 | Tragic 61.7% |
| Immigrants | Serbia | 0.0 /100 | #322 | Tragic 61.6% |
| Tlingit-Haida | 0.0 /100 | #323 | Tragic 61.6% |