Bulgarian vs Immigrants from Middle Africa Family Households
COMPARE
Bulgarian
Immigrants from Middle Africa
Family Households
Family Households Comparison
Bulgarians
Immigrants from Middle Africa
63.6%
FAMILY HOUSEHOLDS
3.4/ 100
METRIC RATING
229th/ 347
METRIC RANK
61.9%
FAMILY HOUSEHOLDS
0.0/ 100
METRIC RATING
316th/ 347
METRIC RANK
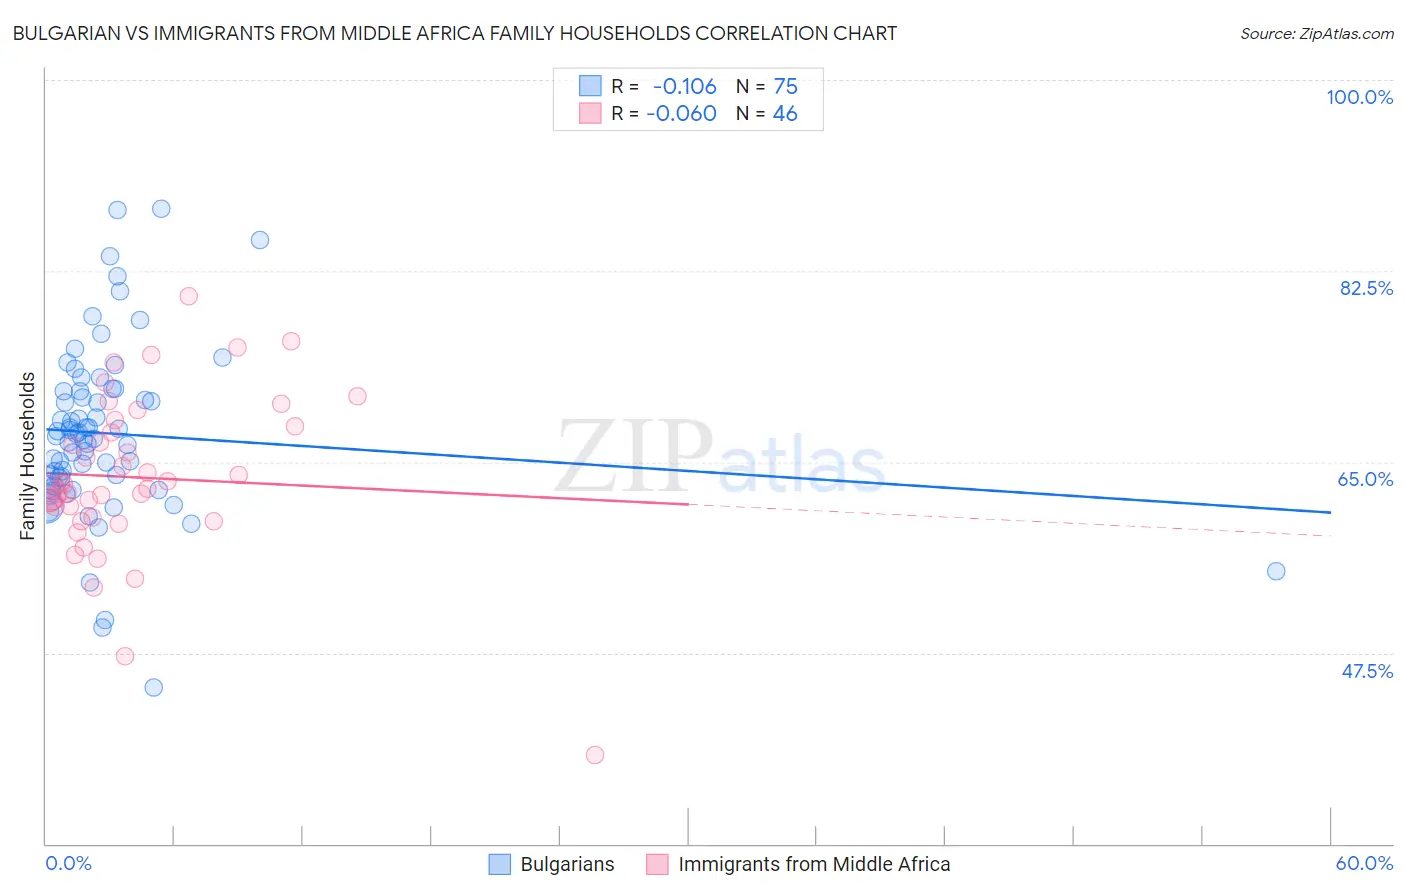
Bulgarian vs Immigrants from Middle Africa Family Households Correlation Chart
The statistical analysis conducted on geographies consisting of 205,566,238 people shows a poor negative correlation between the proportion of Bulgarians and percentage of family households in the United States with a correlation coefficient (R) of -0.106 and weighted average of 63.6%. Similarly, the statistical analysis conducted on geographies consisting of 202,657,833 people shows a slight negative correlation between the proportion of Immigrants from Middle Africa and percentage of family households in the United States with a correlation coefficient (R) of -0.060 and weighted average of 61.9%, a difference of 2.7%.
Family Households Correlation Summary
| Measurement | Bulgarian | Immigrants from Middle Africa |
| Minimum | 44.3% | 38.1% |
| Maximum | 88.1% | 80.2% |
| Range | 43.8% | 42.1% |
| Mean | 67.6% | 63.6% |
| Median | 67.4% | 62.7% |
| Interquartile 25% (IQ1) | 62.8% | 60.0% |
| Interquartile 75% (IQ3) | 71.5% | 68.3% |
| Interquartile Range (IQR) | 8.7% | 8.4% |
| Standard Deviation (Sample) | 8.0% | 7.5% |
| Standard Deviation (Population) | 7.9% | 7.5% |
Similar Demographics by Family Households
Demographics Similar to Bulgarians by Family Households
In terms of family households, the demographic groups most similar to Bulgarians are Blackfeet (63.6%, a difference of 0.020%), Immigrants from Brazil (63.6%, a difference of 0.040%), Immigrants from Greece (63.5%, a difference of 0.060%), Immigrants from Bahamas (63.6%, a difference of 0.070%), and Trinidadian and Tobagonian (63.6%, a difference of 0.070%).
| Demographics | Rating | Rank | Family Households |
| Immigrants | Belarus | 5.5 /100 | #222 | Tragic 63.7% |
| French Canadians | 5.4 /100 | #223 | Tragic 63.7% |
| Turks | 4.5 /100 | #224 | Tragic 63.6% |
| Immigrants | Hungary | 4.3 /100 | #225 | Tragic 63.6% |
| Immigrants | Bahamas | 4.2 /100 | #226 | Tragic 63.6% |
| Trinidadians and Tobagonians | 4.1 /100 | #227 | Tragic 63.6% |
| Blackfeet | 3.6 /100 | #228 | Tragic 63.6% |
| Bulgarians | 3.4 /100 | #229 | Tragic 63.6% |
| Immigrants | Brazil | 3.0 /100 | #230 | Tragic 63.6% |
| Immigrants | Greece | 2.9 /100 | #231 | Tragic 63.5% |
| Immigrants | Northern Africa | 2.6 /100 | #232 | Tragic 63.5% |
| Immigrants | Armenia | 2.6 /100 | #233 | Tragic 63.5% |
| Finns | 2.3 /100 | #234 | Tragic 63.5% |
| Albanians | 2.2 /100 | #235 | Tragic 63.5% |
| Ghanaians | 2.1 /100 | #236 | Tragic 63.5% |
Demographics Similar to Immigrants from Middle Africa by Family Households
In terms of family households, the demographic groups most similar to Immigrants from Middle Africa are Moroccan (61.9%, a difference of 0.040%), Immigrants from Bosnia and Herzegovina (61.9%, a difference of 0.040%), Immigrants from Cabo Verde (61.9%, a difference of 0.080%), Alaskan Athabascan (61.8%, a difference of 0.12%), and Liberian (62.0%, a difference of 0.13%).
| Demographics | Rating | Rank | Family Households |
| Sub-Saharan Africans | 0.0 /100 | #309 | Tragic 62.1% |
| Immigrants | Liberia | 0.0 /100 | #310 | Tragic 62.0% |
| Immigrants | Morocco | 0.0 /100 | #311 | Tragic 62.0% |
| Immigrants | Latvia | 0.0 /100 | #312 | Tragic 62.0% |
| Liberians | 0.0 /100 | #313 | Tragic 62.0% |
| Immigrants | Cabo Verde | 0.0 /100 | #314 | Tragic 61.9% |
| Moroccans | 0.0 /100 | #315 | Tragic 61.9% |
| Immigrants | Middle Africa | 0.0 /100 | #316 | Tragic 61.9% |
| Immigrants | Bosnia and Herzegovina | 0.0 /100 | #317 | Tragic 61.9% |
| Alaskan Athabascans | 0.0 /100 | #318 | Tragic 61.8% |
| Cape Verdeans | 0.0 /100 | #319 | Tragic 61.8% |
| Ugandans | 0.0 /100 | #320 | Tragic 61.7% |
| Alsatians | 0.0 /100 | #321 | Tragic 61.7% |
| Immigrants | Serbia | 0.0 /100 | #322 | Tragic 61.6% |
| Tlingit-Haida | 0.0 /100 | #323 | Tragic 61.6% |