Danish vs Yaqui Family Households
COMPARE
Danish
Yaqui
Family Households
Family Households Comparison
Danes
Yaqui
66.0%
FAMILY HOUSEHOLDS
100.0/ 100
METRIC RATING
61st/ 347
METRIC RANK
65.6%
FAMILY HOUSEHOLDS
99.8/ 100
METRIC RATING
78th/ 347
METRIC RANK
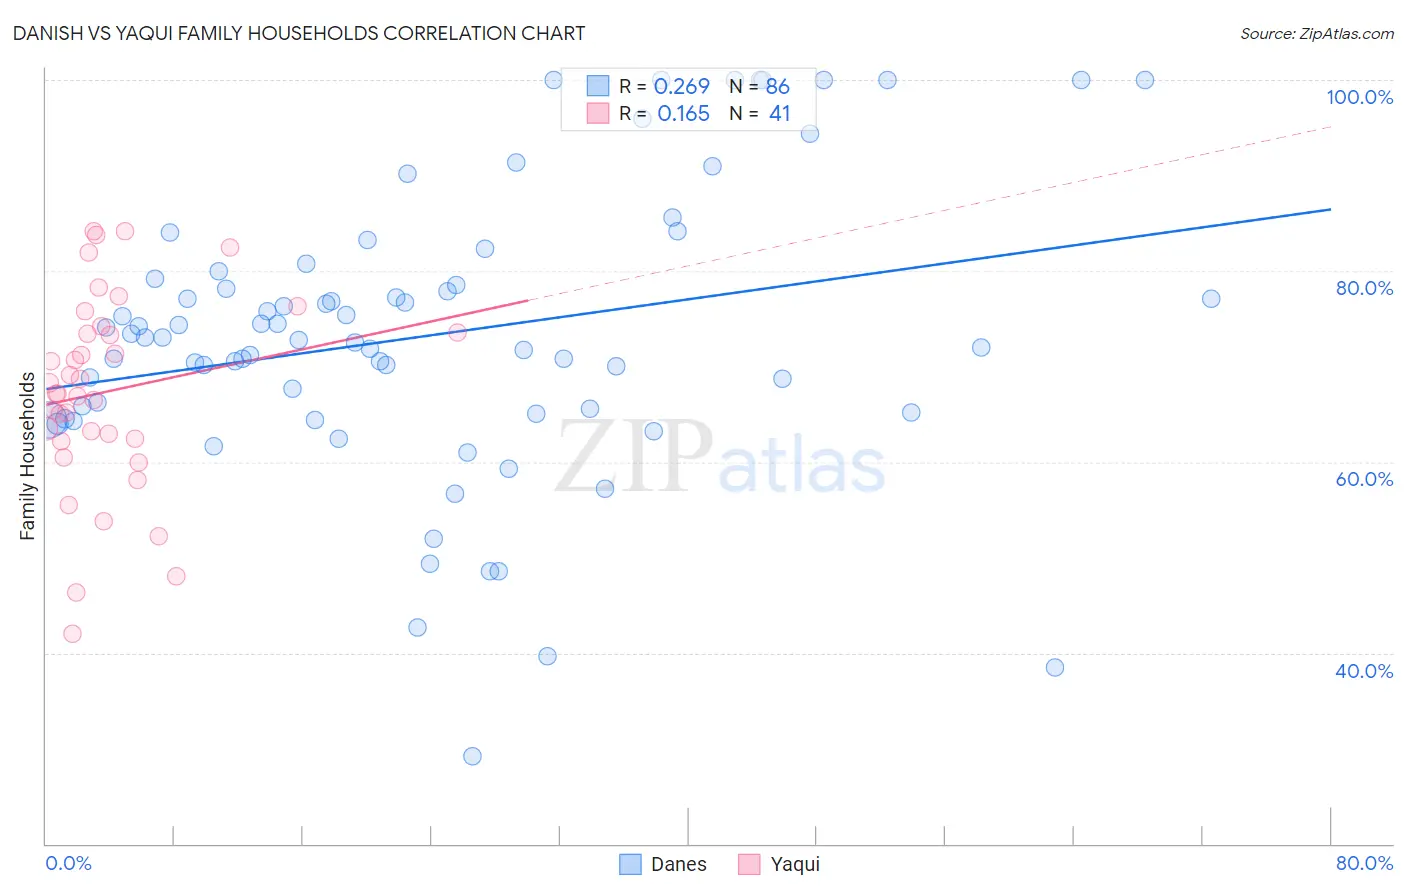
Danish vs Yaqui Family Households Correlation Chart
The statistical analysis conducted on geographies consisting of 473,910,388 people shows a weak positive correlation between the proportion of Danes and percentage of family households in the United States with a correlation coefficient (R) of 0.269 and weighted average of 66.0%. Similarly, the statistical analysis conducted on geographies consisting of 107,720,236 people shows a poor positive correlation between the proportion of Yaqui and percentage of family households in the United States with a correlation coefficient (R) of 0.165 and weighted average of 65.6%, a difference of 0.60%.
Family Households Correlation Summary
| Measurement | Danish | Yaqui |
| Minimum | 29.2% | 41.9% |
| Maximum | 100.0% | 84.2% |
| Range | 70.8% | 42.3% |
| Mean | 73.3% | 67.4% |
| Median | 72.9% | 67.2% |
| Interquartile 25% (IQ1) | 65.2% | 62.3% |
| Interquartile 75% (IQ3) | 79.2% | 73.9% |
| Interquartile Range (IQR) | 14.0% | 11.6% |
| Standard Deviation (Sample) | 14.9% | 10.2% |
| Standard Deviation (Population) | 14.8% | 10.1% |
Demographics Similar to Danes and Yaqui by Family Households
In terms of family households, the demographic groups most similar to Danes are South American (66.0%, a difference of 0.020%), Immigrants from Korea (66.0%, a difference of 0.030%), Central American (66.0%, a difference of 0.030%), Immigrants from Indonesia (66.0%, a difference of 0.070%), and Pima (65.9%, a difference of 0.13%). Similarly, the demographic groups most similar to Yaqui are Immigrants from South America (65.6%, a difference of 0.0%), Immigrants from the Azores (65.6%, a difference of 0.010%), Immigrants from Costa Rica (65.6%, a difference of 0.030%), Houma (65.7%, a difference of 0.12%), and Burmese (65.7%, a difference of 0.18%).
| Demographics | Rating | Rank | Family Households |
| Immigrants | Korea | 100.0 /100 | #59 | Exceptional 66.0% |
| South Americans | 100.0 /100 | #60 | Exceptional 66.0% |
| Danes | 100.0 /100 | #61 | Exceptional 66.0% |
| Central Americans | 100.0 /100 | #62 | Exceptional 66.0% |
| Immigrants | Indonesia | 100.0 /100 | #63 | Exceptional 66.0% |
| Pima | 99.9 /100 | #64 | Exceptional 65.9% |
| Costa Ricans | 99.9 /100 | #65 | Exceptional 65.9% |
| Fijians | 99.9 /100 | #66 | Exceptional 65.9% |
| Filipinos | 99.9 /100 | #67 | Exceptional 65.9% |
| Japanese | 99.9 /100 | #68 | Exceptional 65.9% |
| Malaysians | 99.9 /100 | #69 | Exceptional 65.9% |
| Immigrants | Afghanistan | 99.9 /100 | #70 | Exceptional 65.9% |
| Bhutanese | 99.9 /100 | #71 | Exceptional 65.9% |
| Portuguese | 99.9 /100 | #72 | Exceptional 65.8% |
| Laotians | 99.9 /100 | #73 | Exceptional 65.8% |
| Burmese | 99.9 /100 | #74 | Exceptional 65.7% |
| Houma | 99.9 /100 | #75 | Exceptional 65.7% |
| Immigrants | Azores | 99.8 /100 | #76 | Exceptional 65.6% |
| Immigrants | South America | 99.8 /100 | #77 | Exceptional 65.6% |
| Yaqui | 99.8 /100 | #78 | Exceptional 65.6% |
| Immigrants | Costa Rica | 99.8 /100 | #79 | Exceptional 65.6% |