Crow vs Afghan Family Households
COMPARE
Crow
Afghan
Family Households
Family Households Comparison
Crow
Afghans
65.3%
FAMILY HOUSEHOLDS
98.9/ 100
METRIC RATING
91st/ 347
METRIC RANK
66.3%
FAMILY HOUSEHOLDS
100.0/ 100
METRIC RATING
53rd/ 347
METRIC RANK
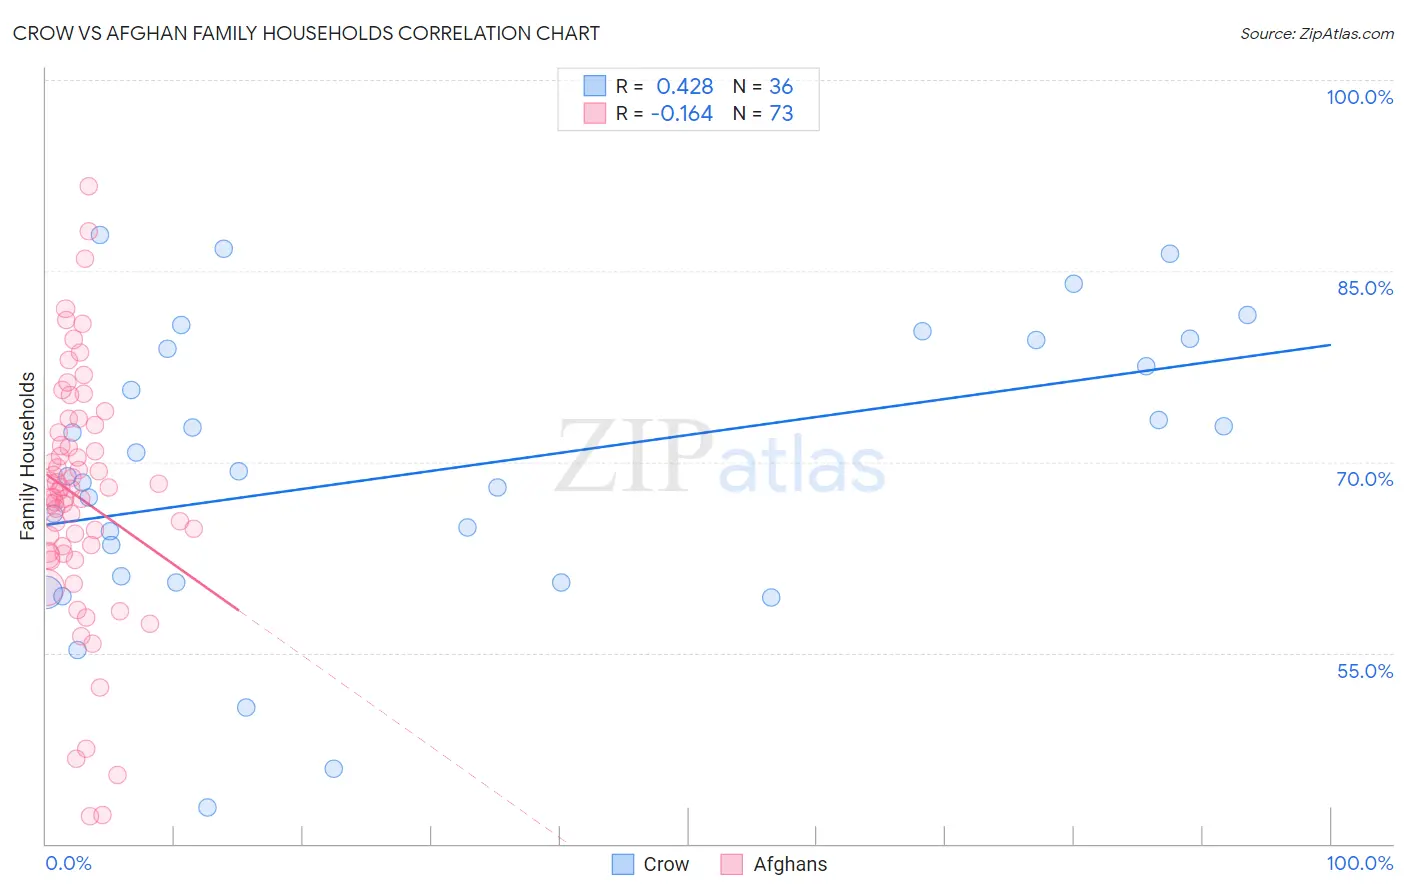
Crow vs Afghan Family Households Correlation Chart
The statistical analysis conducted on geographies consisting of 59,202,817 people shows a moderate positive correlation between the proportion of Crow and percentage of family households in the United States with a correlation coefficient (R) of 0.428 and weighted average of 65.3%. Similarly, the statistical analysis conducted on geographies consisting of 148,833,722 people shows a poor negative correlation between the proportion of Afghans and percentage of family households in the United States with a correlation coefficient (R) of -0.164 and weighted average of 66.3%, a difference of 1.5%.
Family Households Correlation Summary
| Measurement | Crow | Afghan |
| Minimum | 42.9% | 42.2% |
| Maximum | 87.9% | 91.7% |
| Range | 45.0% | 49.5% |
| Mean | 69.3% | 67.2% |
| Median | 69.0% | 67.7% |
| Interquartile 25% (IQ1) | 60.8% | 62.8% |
| Interquartile 75% (IQ3) | 79.2% | 72.6% |
| Interquartile Range (IQR) | 18.4% | 9.8% |
| Standard Deviation (Sample) | 11.2% | 9.6% |
| Standard Deviation (Population) | 11.1% | 9.6% |
Similar Demographics by Family Households
Demographics Similar to Crow by Family Households
In terms of family households, the demographic groups most similar to Crow are Hopi (65.3%, a difference of 0.040%), Immigrants from Laos (65.3%, a difference of 0.050%), Guyanese (65.3%, a difference of 0.050%), Immigrants from Caribbean (65.3%, a difference of 0.060%), and Immigrants from Poland (65.2%, a difference of 0.060%).
| Demographics | Rating | Rank | Family Households |
| Americans | 99.6 /100 | #84 | Exceptional 65.5% |
| Immigrants | Cambodia | 99.5 /100 | #85 | Exceptional 65.4% |
| Egyptians | 99.4 /100 | #86 | Exceptional 65.4% |
| Immigrants | Egypt | 99.2 /100 | #87 | Exceptional 65.3% |
| Immigrants | Haiti | 99.1 /100 | #88 | Exceptional 65.3% |
| Immigrants | Caribbean | 99.1 /100 | #89 | Exceptional 65.3% |
| Immigrants | Laos | 99.1 /100 | #90 | Exceptional 65.3% |
| Crow | 98.9 /100 | #91 | Exceptional 65.3% |
| Hopi | 98.8 /100 | #92 | Exceptional 65.3% |
| Guyanese | 98.8 /100 | #93 | Exceptional 65.3% |
| Immigrants | Poland | 98.7 /100 | #94 | Exceptional 65.2% |
| Immigrants | Portugal | 98.6 /100 | #95 | Exceptional 65.2% |
| Swiss | 98.6 /100 | #96 | Exceptional 65.2% |
| Guatemalans | 98.6 /100 | #97 | Exceptional 65.2% |
| Immigrants | Syria | 98.4 /100 | #98 | Exceptional 65.2% |
Demographics Similar to Afghans by Family Households
In terms of family households, the demographic groups most similar to Afghans are Immigrants from Colombia (66.3%, a difference of 0.0%), Colombian (66.3%, a difference of 0.010%), Native/Alaskan (66.4%, a difference of 0.14%), Navajo (66.4%, a difference of 0.17%), and Immigrants (66.1%, a difference of 0.17%).
| Demographics | Rating | Rank | Family Households |
| Arapaho | 100.0 /100 | #46 | Exceptional 66.5% |
| Bolivians | 100.0 /100 | #47 | Exceptional 66.5% |
| Immigrants | Venezuela | 100.0 /100 | #48 | Exceptional 66.4% |
| Immigrants | South Central Asia | 100.0 /100 | #49 | Exceptional 66.4% |
| Navajo | 100.0 /100 | #50 | Exceptional 66.4% |
| Natives/Alaskans | 100.0 /100 | #51 | Exceptional 66.4% |
| Colombians | 100.0 /100 | #52 | Exceptional 66.3% |
| Afghans | 100.0 /100 | #53 | Exceptional 66.3% |
| Immigrants | Colombia | 100.0 /100 | #54 | Exceptional 66.3% |
| Immigrants | Immigrants | 100.0 /100 | #55 | Exceptional 66.1% |
| Immigrants | Hong Kong | 100.0 /100 | #56 | Exceptional 66.1% |
| Pennsylvania Germans | 100.0 /100 | #57 | Exceptional 66.1% |
| Immigrants | Asia | 100.0 /100 | #58 | Exceptional 66.1% |
| Immigrants | Korea | 100.0 /100 | #59 | Exceptional 66.0% |
| South Americans | 100.0 /100 | #60 | Exceptional 66.0% |