Crow vs Austrian Family Households
COMPARE
Crow
Austrian
Family Households
Family Households Comparison
Crow
Austrians
65.3%
FAMILY HOUSEHOLDS
98.9/ 100
METRIC RATING
91st/ 347
METRIC RANK
64.5%
FAMILY HOUSEHOLDS
68.5/ 100
METRIC RATING
154th/ 347
METRIC RANK
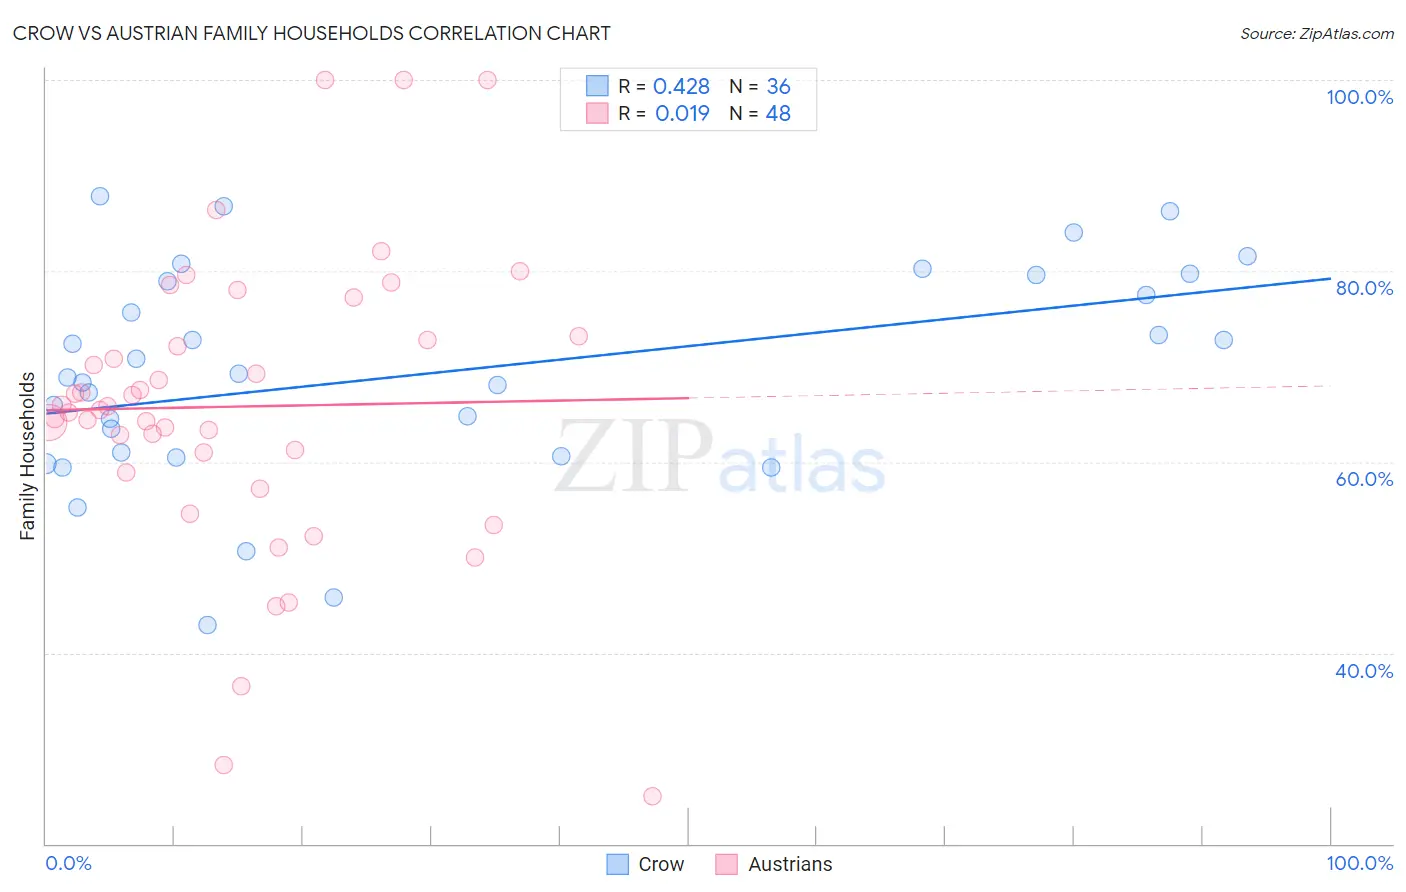
Crow vs Austrian Family Households Correlation Chart
The statistical analysis conducted on geographies consisting of 59,202,817 people shows a moderate positive correlation between the proportion of Crow and percentage of family households in the United States with a correlation coefficient (R) of 0.428 and weighted average of 65.3%. Similarly, the statistical analysis conducted on geographies consisting of 451,810,725 people shows no correlation between the proportion of Austrians and percentage of family households in the United States with a correlation coefficient (R) of 0.019 and weighted average of 64.5%, a difference of 1.3%.
Family Households Correlation Summary
| Measurement | Crow | Austrian |
| Minimum | 42.9% | 25.0% |
| Maximum | 87.9% | 100.0% |
| Range | 45.0% | 75.0% |
| Mean | 69.3% | 65.8% |
| Median | 69.0% | 65.7% |
| Interquartile 25% (IQ1) | 60.8% | 60.0% |
| Interquartile 75% (IQ3) | 79.2% | 72.9% |
| Interquartile Range (IQR) | 18.4% | 13.0% |
| Standard Deviation (Sample) | 11.2% | 15.5% |
| Standard Deviation (Population) | 11.1% | 15.4% |
Similar Demographics by Family Households
Demographics Similar to Crow by Family Households
In terms of family households, the demographic groups most similar to Crow are Hopi (65.3%, a difference of 0.040%), Immigrants from Laos (65.3%, a difference of 0.050%), Guyanese (65.3%, a difference of 0.050%), Immigrants from Caribbean (65.3%, a difference of 0.060%), and Immigrants from Poland (65.2%, a difference of 0.060%).
| Demographics | Rating | Rank | Family Households |
| Americans | 99.6 /100 | #84 | Exceptional 65.5% |
| Immigrants | Cambodia | 99.5 /100 | #85 | Exceptional 65.4% |
| Egyptians | 99.4 /100 | #86 | Exceptional 65.4% |
| Immigrants | Egypt | 99.2 /100 | #87 | Exceptional 65.3% |
| Immigrants | Haiti | 99.1 /100 | #88 | Exceptional 65.3% |
| Immigrants | Caribbean | 99.1 /100 | #89 | Exceptional 65.3% |
| Immigrants | Laos | 99.1 /100 | #90 | Exceptional 65.3% |
| Crow | 98.9 /100 | #91 | Exceptional 65.3% |
| Hopi | 98.8 /100 | #92 | Exceptional 65.3% |
| Guyanese | 98.8 /100 | #93 | Exceptional 65.3% |
| Immigrants | Poland | 98.7 /100 | #94 | Exceptional 65.2% |
| Immigrants | Portugal | 98.6 /100 | #95 | Exceptional 65.2% |
| Swiss | 98.6 /100 | #96 | Exceptional 65.2% |
| Guatemalans | 98.6 /100 | #97 | Exceptional 65.2% |
| Immigrants | Syria | 98.4 /100 | #98 | Exceptional 65.2% |
Demographics Similar to Austrians by Family Households
In terms of family households, the demographic groups most similar to Austrians are Uruguayan (64.5%, a difference of 0.010%), Swedish (64.5%, a difference of 0.020%), Czech (64.5%, a difference of 0.020%), Canadian (64.4%, a difference of 0.030%), and Lebanese (64.4%, a difference of 0.030%).
| Demographics | Rating | Rank | Family Households |
| Immigrants | Chile | 76.5 /100 | #147 | Good 64.6% |
| Delaware | 76.3 /100 | #148 | Good 64.6% |
| Sioux | 76.3 /100 | #149 | Good 64.6% |
| Romanians | 75.3 /100 | #150 | Good 64.5% |
| Syrians | 75.2 /100 | #151 | Good 64.5% |
| Scottish | 70.9 /100 | #152 | Good 64.5% |
| Swedes | 69.8 /100 | #153 | Good 64.5% |
| Austrians | 68.5 /100 | #154 | Good 64.5% |
| Uruguayans | 67.7 /100 | #155 | Good 64.5% |
| Czechs | 67.0 /100 | #156 | Good 64.5% |
| Canadians | 66.6 /100 | #157 | Good 64.4% |
| Lebanese | 66.4 /100 | #158 | Good 64.4% |
| Germans | 65.8 /100 | #159 | Good 64.4% |
| Immigrants | Moldova | 65.2 /100 | #160 | Good 64.4% |
| Immigrants | England | 62.6 /100 | #161 | Good 64.4% |