Chilean vs Immigrants from Pakistan Family Households
COMPARE
Chilean
Immigrants from Pakistan
Family Households
Family Households Comparison
Chileans
Immigrants from Pakistan
65.2%
FAMILY HOUSEHOLDS
98.1/ 100
METRIC RATING
101st/ 347
METRIC RANK
67.7%
FAMILY HOUSEHOLDS
100.0/ 100
METRIC RATING
23rd/ 347
METRIC RANK
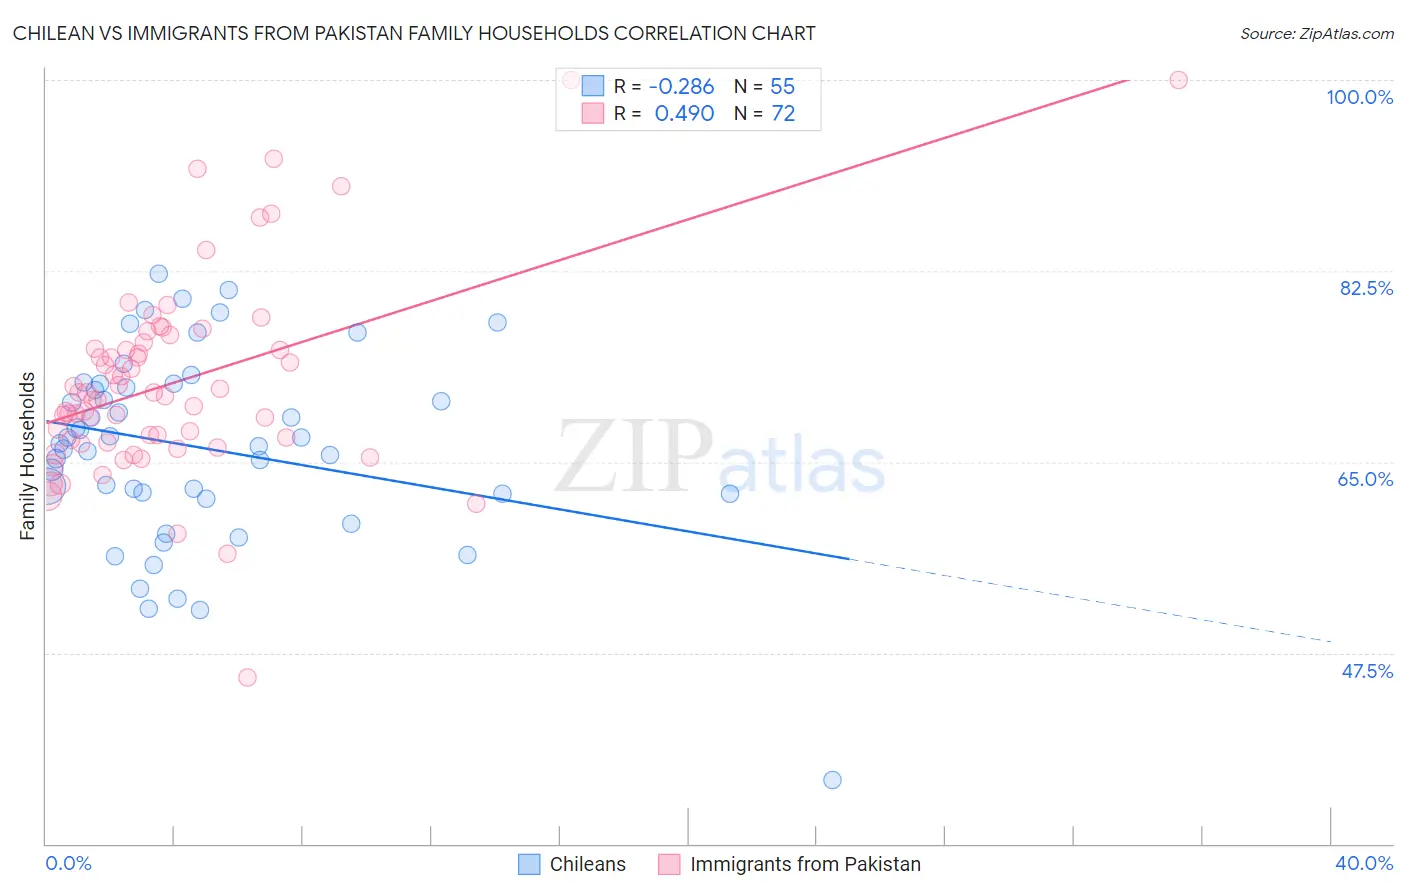
Chilean vs Immigrants from Pakistan Family Households Correlation Chart
The statistical analysis conducted on geographies consisting of 256,564,731 people shows a weak negative correlation between the proportion of Chileans and percentage of family households in the United States with a correlation coefficient (R) of -0.286 and weighted average of 65.2%. Similarly, the statistical analysis conducted on geographies consisting of 283,802,176 people shows a moderate positive correlation between the proportion of Immigrants from Pakistan and percentage of family households in the United States with a correlation coefficient (R) of 0.490 and weighted average of 67.7%, a difference of 3.8%.
Family Households Correlation Summary
| Measurement | Chilean | Immigrants from Pakistan |
| Minimum | 35.8% | 45.3% |
| Maximum | 82.2% | 100.0% |
| Range | 46.4% | 54.7% |
| Mean | 66.3% | 72.3% |
| Median | 66.7% | 71.1% |
| Interquartile 25% (IQ1) | 62.0% | 66.9% |
| Interquartile 75% (IQ3) | 72.1% | 75.7% |
| Interquartile Range (IQR) | 10.1% | 8.8% |
| Standard Deviation (Sample) | 8.8% | 9.1% |
| Standard Deviation (Population) | 8.8% | 9.1% |
Similar Demographics by Family Households
Demographics Similar to Chileans by Family Households
In terms of family households, the demographic groups most similar to Chileans are Haitian (65.2%, a difference of 0.0%), Immigrants from Sri Lanka (65.1%, a difference of 0.020%), Central American Indian (65.2%, a difference of 0.040%), Indian (Asian) (65.1%, a difference of 0.040%), and Spaniard (65.1%, a difference of 0.040%).
| Demographics | Rating | Rank | Family Households |
| Immigrants | Poland | 98.7 /100 | #94 | Exceptional 65.2% |
| Immigrants | Portugal | 98.6 /100 | #95 | Exceptional 65.2% |
| Swiss | 98.6 /100 | #96 | Exceptional 65.2% |
| Guatemalans | 98.6 /100 | #97 | Exceptional 65.2% |
| Immigrants | Syria | 98.4 /100 | #98 | Exceptional 65.2% |
| Central American Indians | 98.3 /100 | #99 | Exceptional 65.2% |
| Haitians | 98.1 /100 | #100 | Exceptional 65.2% |
| Chileans | 98.1 /100 | #101 | Exceptional 65.2% |
| Immigrants | Sri Lanka | 98.0 /100 | #102 | Exceptional 65.1% |
| Indians (Asian) | 97.9 /100 | #103 | Exceptional 65.1% |
| Spaniards | 97.8 /100 | #104 | Exceptional 65.1% |
| English | 97.4 /100 | #105 | Exceptional 65.1% |
| Whites/Caucasians | 97.3 /100 | #106 | Exceptional 65.1% |
| Alaska Natives | 97.3 /100 | #107 | Exceptional 65.1% |
| Palestinians | 97.2 /100 | #108 | Exceptional 65.1% |
Demographics Similar to Immigrants from Pakistan by Family Households
In terms of family households, the demographic groups most similar to Immigrants from Pakistan are Sri Lankan (67.7%, a difference of 0.090%), Cuban (67.7%, a difference of 0.12%), Inupiat (67.8%, a difference of 0.17%), Immigrants from South Eastern Asia (67.5%, a difference of 0.28%), and Immigrants from Nicaragua (67.5%, a difference of 0.31%).
| Demographics | Rating | Rank | Family Households |
| Immigrants | Vietnam | 100.0 /100 | #16 | Exceptional 68.2% |
| Chinese | 100.0 /100 | #17 | Exceptional 68.1% |
| Immigrants | Taiwan | 100.0 /100 | #18 | Exceptional 68.0% |
| Samoans | 100.0 /100 | #19 | Exceptional 67.9% |
| Inupiat | 100.0 /100 | #20 | Exceptional 67.8% |
| Cubans | 100.0 /100 | #21 | Exceptional 67.7% |
| Sri Lankans | 100.0 /100 | #22 | Exceptional 67.7% |
| Immigrants | Pakistan | 100.0 /100 | #23 | Exceptional 67.7% |
| Immigrants | South Eastern Asia | 100.0 /100 | #24 | Exceptional 67.5% |
| Immigrants | Nicaragua | 100.0 /100 | #25 | Exceptional 67.5% |
| Immigrants | India | 100.0 /100 | #26 | Exceptional 67.4% |
| Hispanics or Latinos | 100.0 /100 | #27 | Exceptional 67.4% |
| Hawaiians | 100.0 /100 | #28 | Exceptional 67.4% |
| Nicaraguans | 100.0 /100 | #29 | Exceptional 67.4% |
| Immigrants | Peru | 100.0 /100 | #30 | Exceptional 67.2% |