Chilean vs Immigrants from Pakistan Child Poverty Among Boys Under 16
COMPARE
Chilean
Immigrants from Pakistan
Child Poverty Among Boys Under 16
Child Poverty Among Boys Under 16 Comparison
Chileans
Immigrants from Pakistan
15.0%
CHILD POVERTY AMONG BOYS UNDER 16
95.8/ 100
METRIC RATING
100th/ 347
METRIC RANK
14.3%
CHILD POVERTY AMONG BOYS UNDER 16
99.0/ 100
METRIC RATING
55th/ 347
METRIC RANK
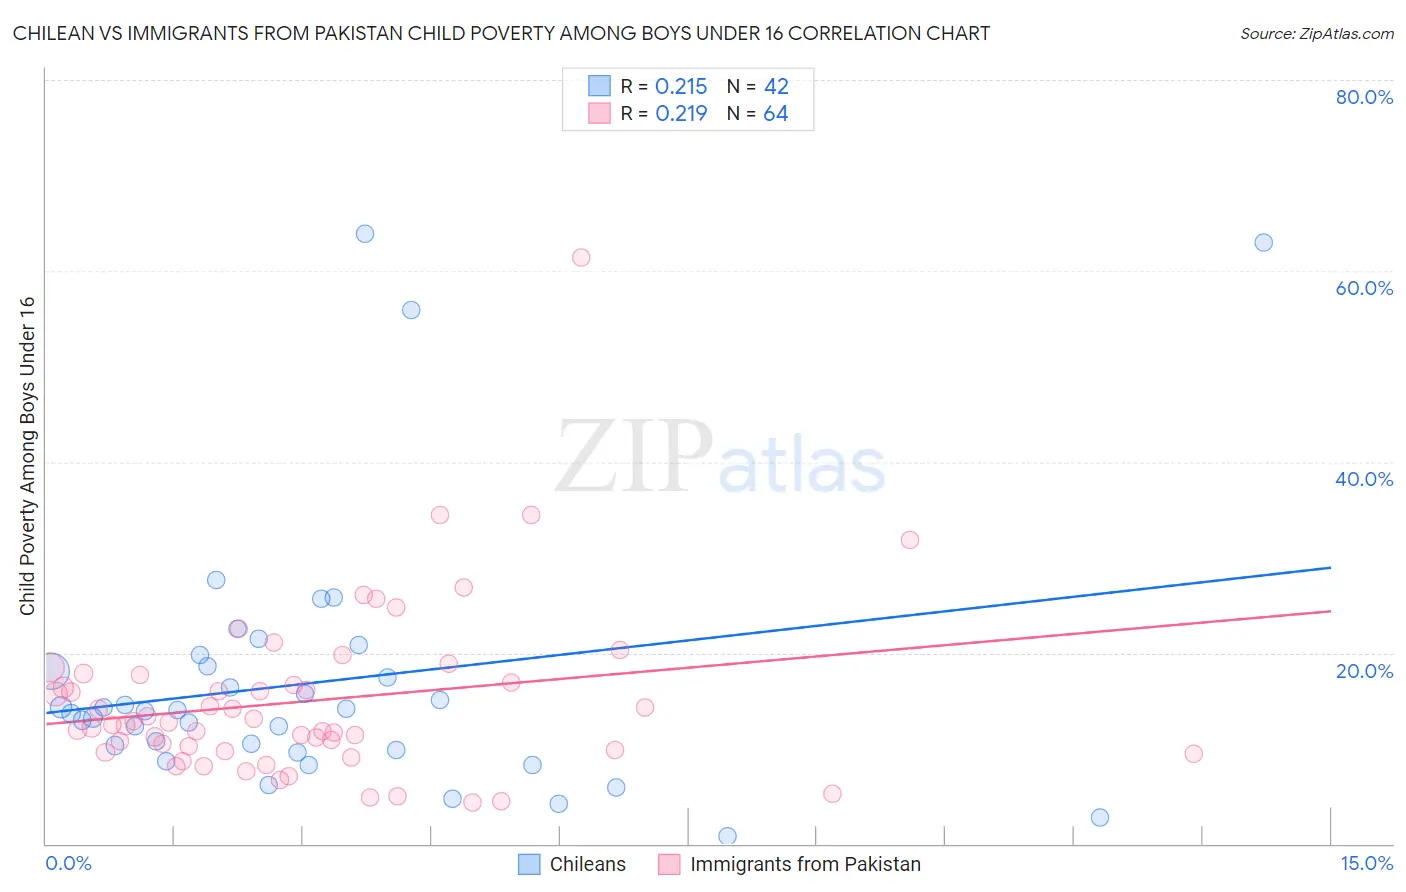
Chilean vs Immigrants from Pakistan Child Poverty Among Boys Under 16 Correlation Chart
The statistical analysis conducted on geographies consisting of 254,368,720 people shows a weak positive correlation between the proportion of Chileans and poverty level among boys under the age of 16 in the United States with a correlation coefficient (R) of 0.215 and weighted average of 15.0%. Similarly, the statistical analysis conducted on geographies consisting of 280,699,242 people shows a weak positive correlation between the proportion of Immigrants from Pakistan and poverty level among boys under the age of 16 in the United States with a correlation coefficient (R) of 0.219 and weighted average of 14.3%, a difference of 4.6%.
Child Poverty Among Boys Under 16 Correlation Summary
| Measurement | Chilean | Immigrants from Pakistan |
| Minimum | 0.79% | 4.3% |
| Maximum | 63.9% | 61.4% |
| Range | 63.1% | 57.1% |
| Mean | 16.9% | 15.0% |
| Median | 13.9% | 12.6% |
| Interquartile 25% (IQ1) | 9.8% | 9.8% |
| Interquartile 75% (IQ3) | 18.6% | 17.2% |
| Interquartile Range (IQR) | 8.8% | 7.4% |
| Standard Deviation (Sample) | 13.8% | 9.0% |
| Standard Deviation (Population) | 13.6% | 8.9% |
Similar Demographics by Child Poverty Among Boys Under 16
Demographics Similar to Chileans by Child Poverty Among Boys Under 16
In terms of child poverty among boys under 16, the demographic groups most similar to Chileans are Immigrants from Belarus (15.0%, a difference of 0.050%), Romanian (15.0%, a difference of 0.13%), Immigrants from Denmark (15.0%, a difference of 0.17%), Immigrants from France (15.0%, a difference of 0.24%), and Immigrants from Switzerland (15.0%, a difference of 0.26%).
| Demographics | Rating | Rank | Child Poverty Among Boys Under 16 |
| Sri Lankans | 96.7 /100 | #93 | Exceptional 14.9% |
| Immigrants | Italy | 96.7 /100 | #94 | Exceptional 14.9% |
| Finns | 96.5 /100 | #95 | Exceptional 14.9% |
| Immigrants | North Macedonia | 96.3 /100 | #96 | Exceptional 14.9% |
| Immigrants | Egypt | 96.2 /100 | #97 | Exceptional 14.9% |
| British | 96.2 /100 | #98 | Exceptional 15.0% |
| Immigrants | France | 96.1 /100 | #99 | Exceptional 15.0% |
| Chileans | 95.8 /100 | #100 | Exceptional 15.0% |
| Immigrants | Belarus | 95.7 /100 | #101 | Exceptional 15.0% |
| Romanians | 95.6 /100 | #102 | Exceptional 15.0% |
| Immigrants | Denmark | 95.6 /100 | #103 | Exceptional 15.0% |
| Immigrants | Switzerland | 95.4 /100 | #104 | Exceptional 15.0% |
| Dutch | 95.4 /100 | #105 | Exceptional 15.0% |
| Serbians | 95.2 /100 | #106 | Exceptional 15.1% |
| Jordanians | 95.1 /100 | #107 | Exceptional 15.1% |
Demographics Similar to Immigrants from Pakistan by Child Poverty Among Boys Under 16
In terms of child poverty among boys under 16, the demographic groups most similar to Immigrants from Pakistan are Zimbabwean (14.3%, a difference of 0.0%), Immigrants from Serbia (14.3%, a difference of 0.050%), Polish (14.4%, a difference of 0.11%), Immigrants from Philippines (14.3%, a difference of 0.13%), and Laotian (14.3%, a difference of 0.17%).
| Demographics | Rating | Rank | Child Poverty Among Boys Under 16 |
| Immigrants | Indonesia | 99.4 /100 | #48 | Exceptional 14.1% |
| Czechs | 99.3 /100 | #49 | Exceptional 14.1% |
| Italians | 99.2 /100 | #50 | Exceptional 14.2% |
| Immigrants | Greece | 99.2 /100 | #51 | Exceptional 14.2% |
| Laotians | 99.0 /100 | #52 | Exceptional 14.3% |
| Immigrants | Philippines | 99.0 /100 | #53 | Exceptional 14.3% |
| Immigrants | Serbia | 99.0 /100 | #54 | Exceptional 14.3% |
| Immigrants | Pakistan | 99.0 /100 | #55 | Exceptional 14.3% |
| Zimbabweans | 99.0 /100 | #56 | Exceptional 14.3% |
| Poles | 98.9 /100 | #57 | Exceptional 14.4% |
| Immigrants | Sweden | 98.9 /100 | #58 | Exceptional 14.4% |
| Immigrants | Czechoslovakia | 98.9 /100 | #59 | Exceptional 14.4% |
| Immigrants | Belgium | 98.9 /100 | #60 | Exceptional 14.4% |
| Scandinavians | 98.8 /100 | #61 | Exceptional 14.4% |
| Immigrants | Israel | 98.7 /100 | #62 | Exceptional 14.4% |