Navajo vs Somali Family Households
COMPARE
Navajo
Somali
Family Households
Family Households Comparison
Navajo
Somalis
66.4%
FAMILY HOUSEHOLDS
100.0/ 100
METRIC RATING
50th/ 347
METRIC RANK
57.6%
FAMILY HOUSEHOLDS
0.0/ 100
METRIC RATING
346th/ 347
METRIC RANK
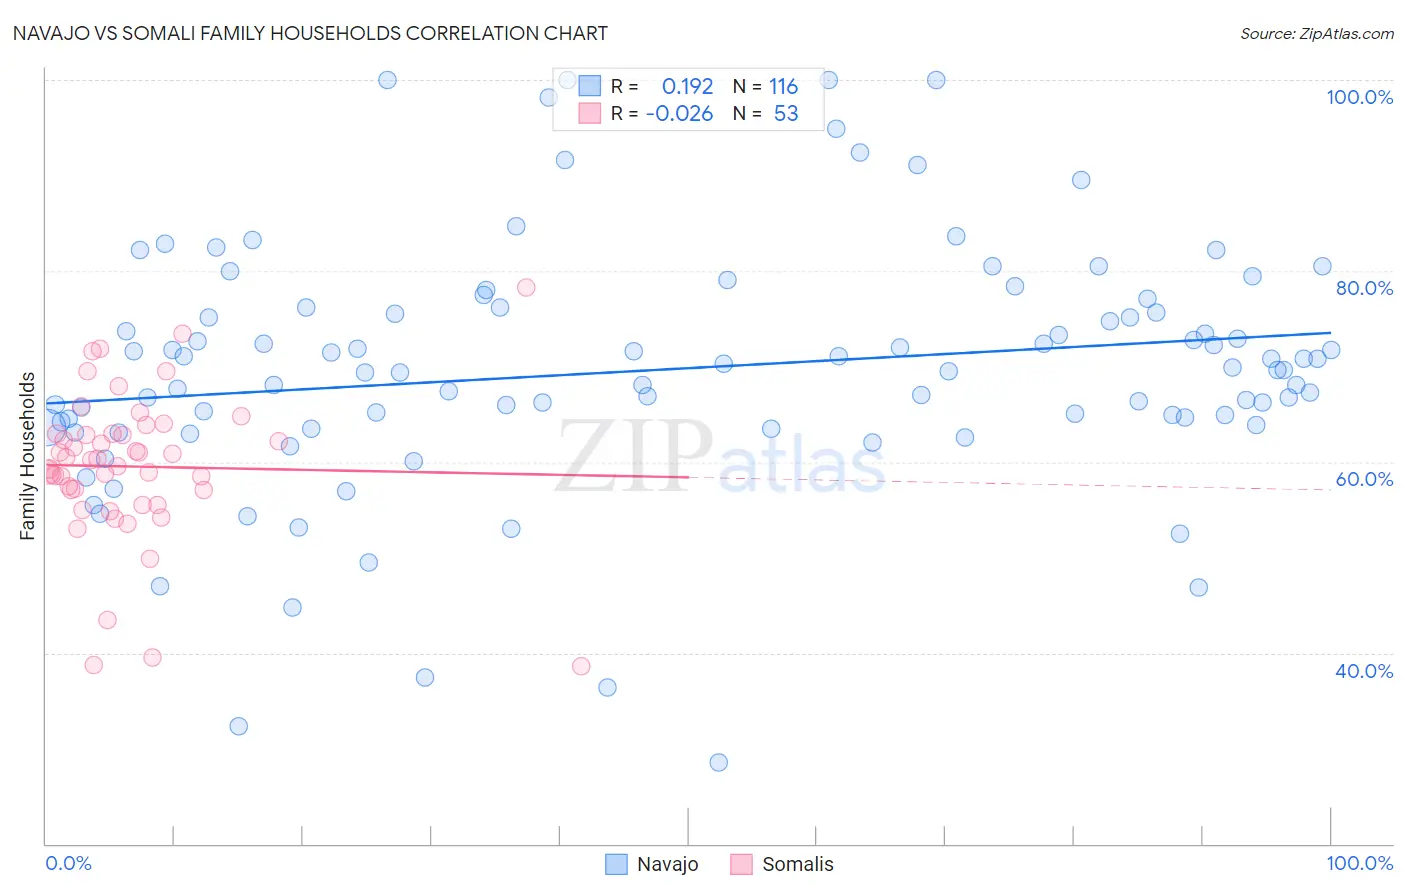
Navajo vs Somali Family Households Correlation Chart
The statistical analysis conducted on geographies consisting of 224,752,458 people shows a poor positive correlation between the proportion of Navajo and percentage of family households in the United States with a correlation coefficient (R) of 0.192 and weighted average of 66.4%. Similarly, the statistical analysis conducted on geographies consisting of 99,263,237 people shows no correlation between the proportion of Somalis and percentage of family households in the United States with a correlation coefficient (R) of -0.026 and weighted average of 57.6%, a difference of 15.1%.
Family Households Correlation Summary
| Measurement | Navajo | Somali |
| Minimum | 28.6% | 38.6% |
| Maximum | 100.0% | 78.2% |
| Range | 71.4% | 39.6% |
| Mean | 69.7% | 59.5% |
| Median | 69.7% | 60.2% |
| Interquartile 25% (IQ1) | 64.0% | 56.3% |
| Interquartile 75% (IQ3) | 75.9% | 62.9% |
| Interquartile Range (IQR) | 11.9% | 6.6% |
| Standard Deviation (Sample) | 13.1% | 7.8% |
| Standard Deviation (Population) | 13.0% | 7.8% |
Similar Demographics by Family Households
Demographics Similar to Navajo by Family Households
In terms of family households, the demographic groups most similar to Navajo are Native/Alaskan (66.4%, a difference of 0.030%), Immigrants from South Central Asia (66.4%, a difference of 0.070%), Immigrants from Venezuela (66.4%, a difference of 0.12%), Bolivian (66.5%, a difference of 0.14%), and Colombian (66.3%, a difference of 0.16%).
| Demographics | Rating | Rank | Family Households |
| Apache | 100.0 /100 | #43 | Exceptional 66.5% |
| Asians | 100.0 /100 | #44 | Exceptional 66.5% |
| Venezuelans | 100.0 /100 | #45 | Exceptional 66.5% |
| Arapaho | 100.0 /100 | #46 | Exceptional 66.5% |
| Bolivians | 100.0 /100 | #47 | Exceptional 66.5% |
| Immigrants | Venezuela | 100.0 /100 | #48 | Exceptional 66.4% |
| Immigrants | South Central Asia | 100.0 /100 | #49 | Exceptional 66.4% |
| Navajo | 100.0 /100 | #50 | Exceptional 66.4% |
| Natives/Alaskans | 100.0 /100 | #51 | Exceptional 66.4% |
| Colombians | 100.0 /100 | #52 | Exceptional 66.3% |
| Afghans | 100.0 /100 | #53 | Exceptional 66.3% |
| Immigrants | Colombia | 100.0 /100 | #54 | Exceptional 66.3% |
| Immigrants | Immigrants | 100.0 /100 | #55 | Exceptional 66.1% |
| Immigrants | Hong Kong | 100.0 /100 | #56 | Exceptional 66.1% |
| Pennsylvania Germans | 100.0 /100 | #57 | Exceptional 66.1% |
Demographics Similar to Somalis by Family Households
In terms of family households, the demographic groups most similar to Somalis are Immigrants from Somalia (56.7%, a difference of 1.7%), Immigrants from Zaire (59.2%, a difference of 2.6%), Immigrants from Congo (59.2%, a difference of 2.8%), Senegalese (59.8%, a difference of 3.8%), and Sudanese (60.0%, a difference of 4.1%).
| Demographics | Rating | Rank | Family Households |
| Immigrants | Ethiopia | 0.0 /100 | #333 | Tragic 61.2% |
| Immigrants | Eastern Africa | 0.0 /100 | #334 | Tragic 61.1% |
| Carpatho Rusyns | 0.0 /100 | #335 | Tragic 61.1% |
| German Russians | 0.0 /100 | #336 | Tragic 60.9% |
| Soviet Union | 0.0 /100 | #337 | Tragic 60.9% |
| Immigrants | Eritrea | 0.0 /100 | #338 | Tragic 60.8% |
| Immigrants | Saudi Arabia | 0.0 /100 | #339 | Tragic 60.7% |
| Immigrants | Sudan | 0.0 /100 | #340 | Tragic 60.2% |
| Immigrants | Senegal | 0.0 /100 | #341 | Tragic 60.1% |
| Sudanese | 0.0 /100 | #342 | Tragic 60.0% |
| Senegalese | 0.0 /100 | #343 | Tragic 59.8% |
| Immigrants | Congo | 0.0 /100 | #344 | Tragic 59.2% |
| Immigrants | Zaire | 0.0 /100 | #345 | Tragic 59.2% |
| Somalis | 0.0 /100 | #346 | Tragic 57.6% |
| Immigrants | Somalia | 0.0 /100 | #347 | Tragic 56.7% |