Cambodian vs Russian Family Households
COMPARE
Cambodian
Russian
Family Households
Family Households Comparison
Cambodians
Russians
61.4%
FAMILY HOUSEHOLDS
0.0/ 100
METRIC RATING
329th/ 347
METRIC RANK
63.4%
FAMILY HOUSEHOLDS
1.4/ 100
METRIC RATING
249th/ 347
METRIC RANK
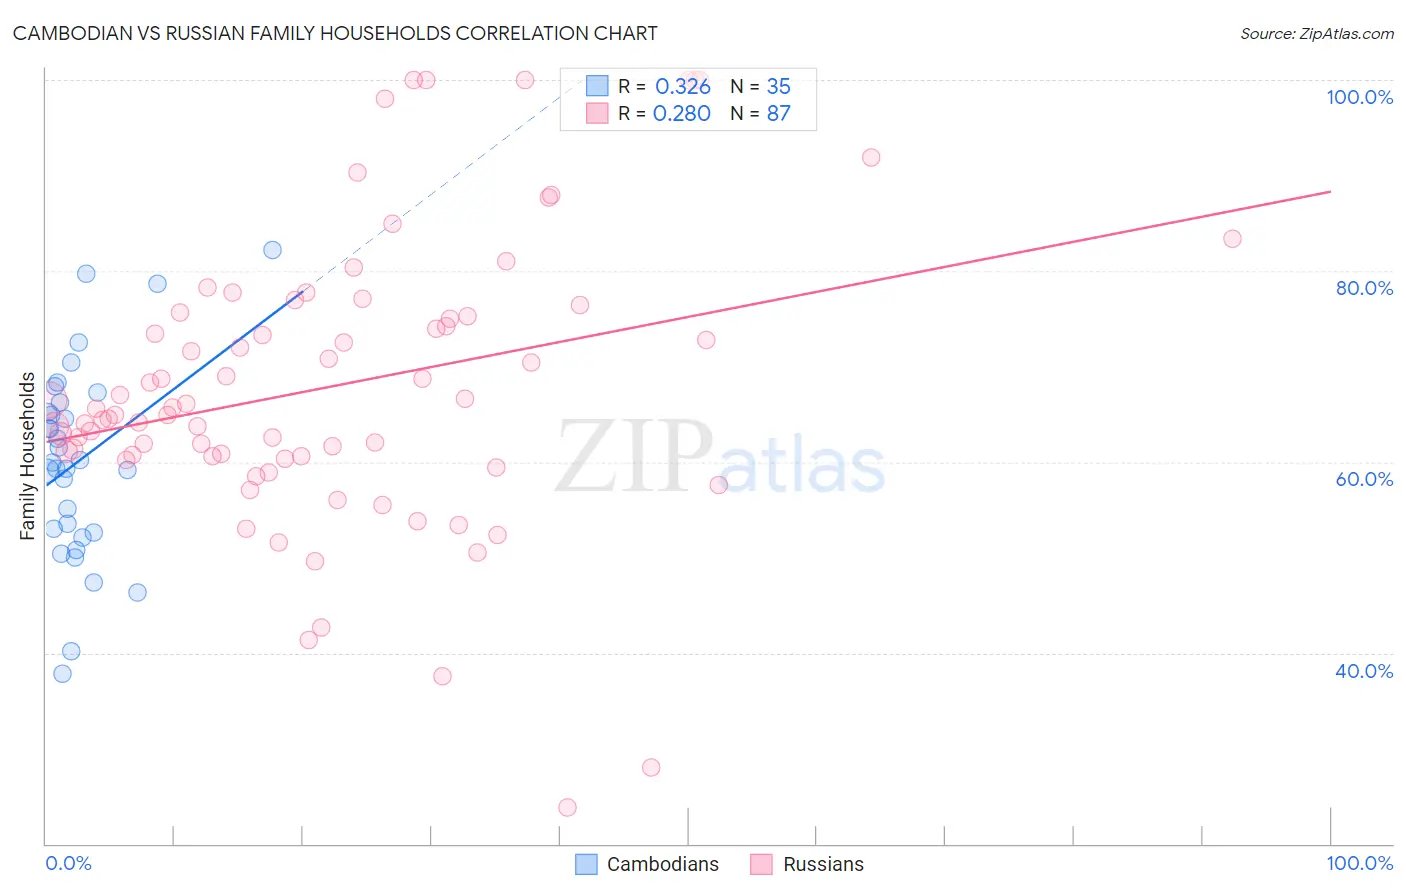
Cambodian vs Russian Family Households Correlation Chart
The statistical analysis conducted on geographies consisting of 102,469,130 people shows a mild positive correlation between the proportion of Cambodians and percentage of family households in the United States with a correlation coefficient (R) of 0.326 and weighted average of 61.4%. Similarly, the statistical analysis conducted on geographies consisting of 511,741,989 people shows a weak positive correlation between the proportion of Russians and percentage of family households in the United States with a correlation coefficient (R) of 0.280 and weighted average of 63.4%, a difference of 3.3%.
Family Households Correlation Summary
| Measurement | Cambodian | Russian |
| Minimum | 37.8% | 23.8% |
| Maximum | 82.2% | 100.0% |
| Range | 44.4% | 76.2% |
| Mean | 60.1% | 68.0% |
| Median | 59.9% | 65.5% |
| Interquartile 25% (IQ1) | 52.6% | 60.6% |
| Interquartile 75% (IQ3) | 66.2% | 75.7% |
| Interquartile Range (IQR) | 13.6% | 15.1% |
| Standard Deviation (Sample) | 10.2% | 15.2% |
| Standard Deviation (Population) | 10.1% | 15.1% |
Similar Demographics by Family Households
Demographics Similar to Cambodians by Family Households
In terms of family households, the demographic groups most similar to Cambodians are Kiowa (61.4%, a difference of 0.030%), Immigrants from Australia (61.3%, a difference of 0.14%), Immigrants from France (61.3%, a difference of 0.14%), Black/African American (61.5%, a difference of 0.15%), and Indonesian (61.5%, a difference of 0.18%).
| Demographics | Rating | Rank | Family Households |
| Immigrants | Serbia | 0.0 /100 | #322 | Tragic 61.6% |
| Tlingit-Haida | 0.0 /100 | #323 | Tragic 61.6% |
| Immigrants | West Indies | 0.0 /100 | #324 | Tragic 61.6% |
| Immigrants | Switzerland | 0.0 /100 | #325 | Tragic 61.6% |
| Indonesians | 0.0 /100 | #326 | Tragic 61.5% |
| Blacks/African Americans | 0.0 /100 | #327 | Tragic 61.5% |
| Kiowa | 0.0 /100 | #328 | Tragic 61.4% |
| Cambodians | 0.0 /100 | #329 | Tragic 61.4% |
| Immigrants | Australia | 0.0 /100 | #330 | Tragic 61.3% |
| Immigrants | France | 0.0 /100 | #331 | Tragic 61.3% |
| Ethiopians | 0.0 /100 | #332 | Tragic 61.2% |
| Immigrants | Ethiopia | 0.0 /100 | #333 | Tragic 61.2% |
| Immigrants | Eastern Africa | 0.0 /100 | #334 | Tragic 61.1% |
| Carpatho Rusyns | 0.0 /100 | #335 | Tragic 61.1% |
| German Russians | 0.0 /100 | #336 | Tragic 60.9% |
Demographics Similar to Russians by Family Households
In terms of family households, the demographic groups most similar to Russians are Dominican (63.4%, a difference of 0.010%), Immigrants from Japan (63.4%, a difference of 0.010%), Immigrants from Uzbekistan (63.4%, a difference of 0.020%), Immigrants from Ghana (63.4%, a difference of 0.030%), and Eastern European (63.4%, a difference of 0.050%).
| Demographics | Rating | Rank | Family Households |
| Immigrants | Israel | 1.8 /100 | #242 | Tragic 63.4% |
| Immigrants | Czechoslovakia | 1.8 /100 | #243 | Tragic 63.4% |
| Eastern Europeans | 1.6 /100 | #244 | Tragic 63.4% |
| Immigrants | Dominica | 1.6 /100 | #245 | Tragic 63.4% |
| Immigrants | Ghana | 1.6 /100 | #246 | Tragic 63.4% |
| Immigrants | Uzbekistan | 1.5 /100 | #247 | Tragic 63.4% |
| Dominicans | 1.5 /100 | #248 | Tragic 63.4% |
| Russians | 1.4 /100 | #249 | Tragic 63.4% |
| Immigrants | Japan | 1.4 /100 | #250 | Tragic 63.4% |
| Taiwanese | 1.2 /100 | #251 | Tragic 63.3% |
| Bahamians | 1.1 /100 | #252 | Tragic 63.3% |
| Immigrants | Dominican Republic | 1.0 /100 | #253 | Tragic 63.3% |
| Slovaks | 1.0 /100 | #254 | Tragic 63.3% |
| Potawatomi | 1.0 /100 | #255 | Tragic 63.3% |
| Luxembourgers | 0.9 /100 | #256 | Tragic 63.3% |