Cambodian vs Finnish Family Households
COMPARE
Cambodian
Finnish
Family Households
Family Households Comparison
Cambodians
Finns
61.4%
FAMILY HOUSEHOLDS
0.0/ 100
METRIC RATING
329th/ 347
METRIC RANK
63.5%
FAMILY HOUSEHOLDS
2.3/ 100
METRIC RATING
234th/ 347
METRIC RANK
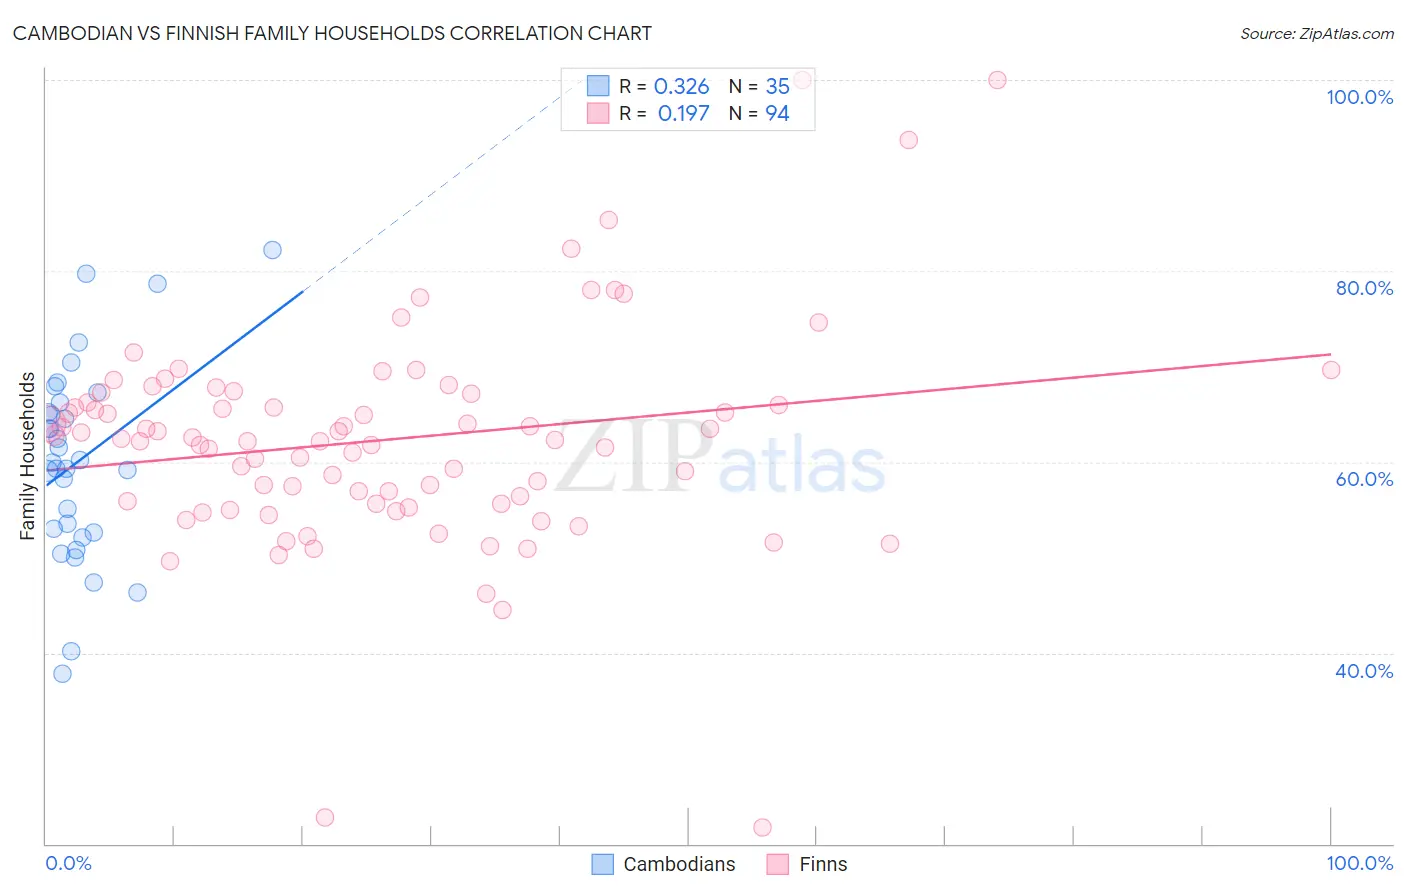
Cambodian vs Finnish Family Households Correlation Chart
The statistical analysis conducted on geographies consisting of 102,469,130 people shows a mild positive correlation between the proportion of Cambodians and percentage of family households in the United States with a correlation coefficient (R) of 0.326 and weighted average of 61.4%. Similarly, the statistical analysis conducted on geographies consisting of 404,508,203 people shows a poor positive correlation between the proportion of Finns and percentage of family households in the United States with a correlation coefficient (R) of 0.197 and weighted average of 63.5%, a difference of 3.5%.
Family Households Correlation Summary
| Measurement | Cambodian | Finnish |
| Minimum | 37.8% | 21.6% |
| Maximum | 82.2% | 100.0% |
| Range | 44.4% | 78.4% |
| Mean | 60.1% | 62.3% |
| Median | 59.9% | 62.4% |
| Interquartile 25% (IQ1) | 52.6% | 55.6% |
| Interquartile 75% (IQ3) | 66.2% | 67.1% |
| Interquartile Range (IQR) | 13.6% | 11.5% |
| Standard Deviation (Sample) | 10.2% | 11.6% |
| Standard Deviation (Population) | 10.1% | 11.6% |
Similar Demographics by Family Households
Demographics Similar to Cambodians by Family Households
In terms of family households, the demographic groups most similar to Cambodians are Kiowa (61.4%, a difference of 0.030%), Immigrants from Australia (61.3%, a difference of 0.14%), Immigrants from France (61.3%, a difference of 0.14%), Black/African American (61.5%, a difference of 0.15%), and Indonesian (61.5%, a difference of 0.18%).
| Demographics | Rating | Rank | Family Households |
| Immigrants | Serbia | 0.0 /100 | #322 | Tragic 61.6% |
| Tlingit-Haida | 0.0 /100 | #323 | Tragic 61.6% |
| Immigrants | West Indies | 0.0 /100 | #324 | Tragic 61.6% |
| Immigrants | Switzerland | 0.0 /100 | #325 | Tragic 61.6% |
| Indonesians | 0.0 /100 | #326 | Tragic 61.5% |
| Blacks/African Americans | 0.0 /100 | #327 | Tragic 61.5% |
| Kiowa | 0.0 /100 | #328 | Tragic 61.4% |
| Cambodians | 0.0 /100 | #329 | Tragic 61.4% |
| Immigrants | Australia | 0.0 /100 | #330 | Tragic 61.3% |
| Immigrants | France | 0.0 /100 | #331 | Tragic 61.3% |
| Ethiopians | 0.0 /100 | #332 | Tragic 61.2% |
| Immigrants | Ethiopia | 0.0 /100 | #333 | Tragic 61.2% |
| Immigrants | Eastern Africa | 0.0 /100 | #334 | Tragic 61.1% |
| Carpatho Rusyns | 0.0 /100 | #335 | Tragic 61.1% |
| German Russians | 0.0 /100 | #336 | Tragic 60.9% |
Demographics Similar to Finns by Family Households
In terms of family households, the demographic groups most similar to Finns are Immigrants from Armenia (63.5%, a difference of 0.030%), Albanian (63.5%, a difference of 0.030%), Immigrants from Northern Africa (63.5%, a difference of 0.040%), Ghanaian (63.5%, a difference of 0.040%), and Comanche (63.5%, a difference of 0.040%).
| Demographics | Rating | Rank | Family Households |
| Trinidadians and Tobagonians | 4.1 /100 | #227 | Tragic 63.6% |
| Blackfeet | 3.6 /100 | #228 | Tragic 63.6% |
| Bulgarians | 3.4 /100 | #229 | Tragic 63.6% |
| Immigrants | Brazil | 3.0 /100 | #230 | Tragic 63.6% |
| Immigrants | Greece | 2.9 /100 | #231 | Tragic 63.5% |
| Immigrants | Northern Africa | 2.6 /100 | #232 | Tragic 63.5% |
| Immigrants | Armenia | 2.6 /100 | #233 | Tragic 63.5% |
| Finns | 2.3 /100 | #234 | Tragic 63.5% |
| Albanians | 2.2 /100 | #235 | Tragic 63.5% |
| Ghanaians | 2.1 /100 | #236 | Tragic 63.5% |
| Comanche | 2.1 /100 | #237 | Tragic 63.5% |
| Immigrants | Zimbabwe | 2.0 /100 | #238 | Tragic 63.5% |
| Aleuts | 1.9 /100 | #239 | Tragic 63.4% |
| South Africans | 1.9 /100 | #240 | Tragic 63.4% |
| Immigrants | St. Vincent and the Grenadines | 1.9 /100 | #241 | Tragic 63.4% |