Cambodian vs Panamanian Married-couple Households
COMPARE
Cambodian
Panamanian
Married-couple Households
Married-couple Households Comparison
Cambodians
Panamanians
45.9%
MARRIED-COUPLE HOUSEHOLDS
21.3/ 100
METRIC RATING
197th/ 347
METRIC RANK
45.2%
MARRIED-COUPLE HOUSEHOLDS
5.5/ 100
METRIC RATING
217th/ 347
METRIC RANK
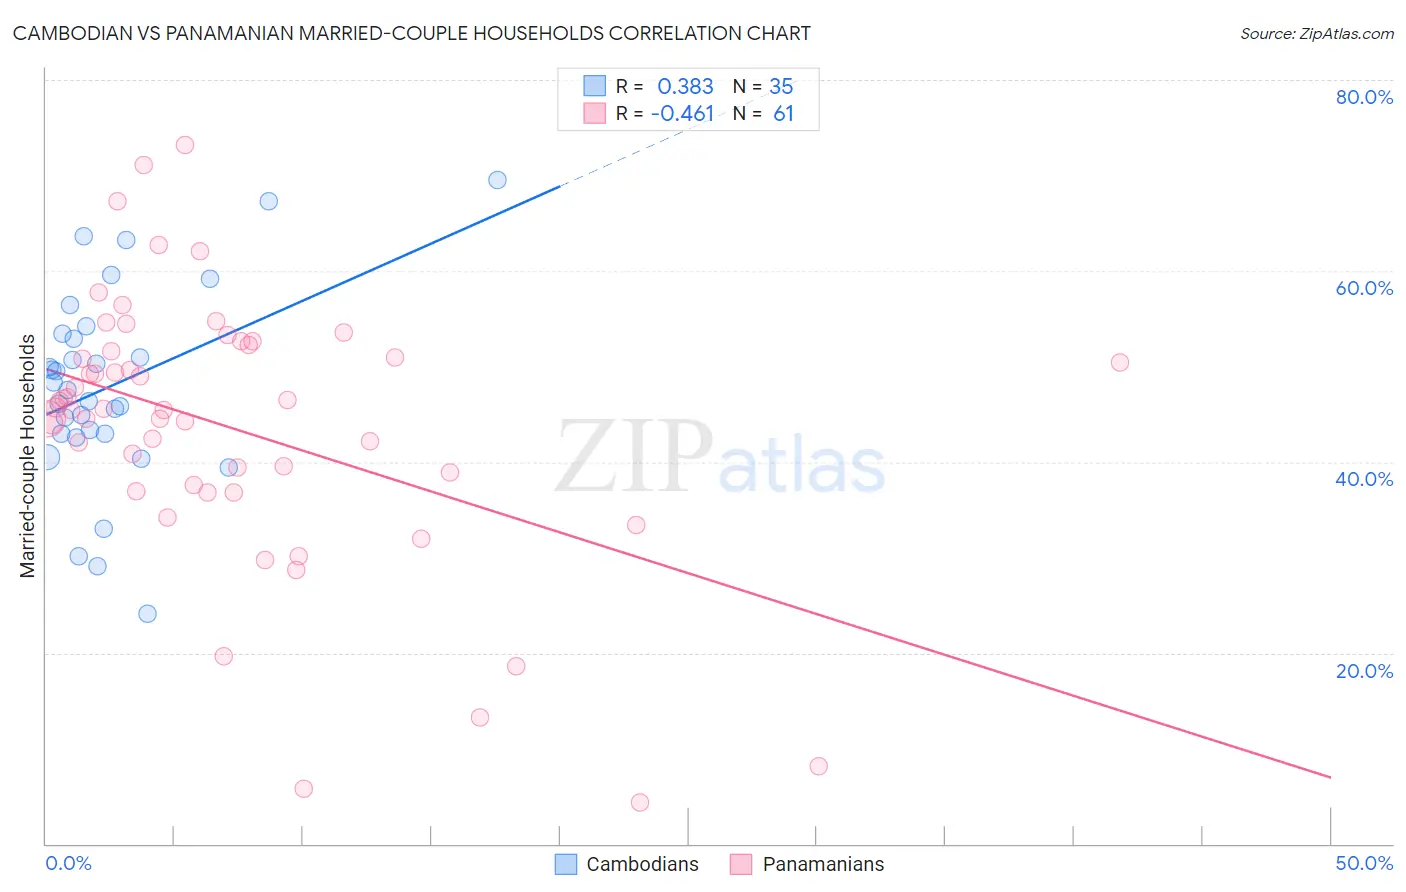
Cambodian vs Panamanian Married-couple Households Correlation Chart
The statistical analysis conducted on geographies consisting of 102,469,130 people shows a mild positive correlation between the proportion of Cambodians and percentage of married-couple family households in the United States with a correlation coefficient (R) of 0.383 and weighted average of 45.9%. Similarly, the statistical analysis conducted on geographies consisting of 281,067,413 people shows a moderate negative correlation between the proportion of Panamanians and percentage of married-couple family households in the United States with a correlation coefficient (R) of -0.461 and weighted average of 45.2%, a difference of 1.5%.
Married-couple Households Correlation Summary
| Measurement | Cambodian | Panamanian |
| Minimum | 24.1% | 4.4% |
| Maximum | 69.5% | 73.1% |
| Range | 45.4% | 68.8% |
| Mean | 47.9% | 43.6% |
| Median | 47.5% | 45.6% |
| Interquartile 25% (IQ1) | 42.9% | 37.2% |
| Interquartile 75% (IQ3) | 53.4% | 51.9% |
| Interquartile Range (IQR) | 10.5% | 14.7% |
| Standard Deviation (Sample) | 10.2% | 14.2% |
| Standard Deviation (Population) | 10.1% | 14.0% |
Demographics Similar to Cambodians and Panamanians by Married-couple Households
In terms of married-couple households, the demographic groups most similar to Cambodians are Ottawa (45.8%, a difference of 0.11%), Carpatho Rusyn (45.7%, a difference of 0.35%), Potawatomi (45.7%, a difference of 0.36%), Immigrants from Serbia (45.7%, a difference of 0.39%), and Immigrants from Central America (45.7%, a difference of 0.47%). Similarly, the demographic groups most similar to Panamanians are Immigrants from Nepal (45.2%, a difference of 0.020%), Immigrants from Portugal (45.2%, a difference of 0.020%), Japanese (45.2%, a difference of 0.040%), Yakama (45.2%, a difference of 0.070%), and Creek (45.3%, a difference of 0.17%).
| Demographics | Rating | Rank | Married-couple Households |
| Cambodians | 21.3 /100 | #197 | Fair 45.9% |
| Ottawa | 19.4 /100 | #198 | Poor 45.8% |
| Carpatho Rusyns | 15.7 /100 | #199 | Poor 45.7% |
| Potawatomi | 15.6 /100 | #200 | Poor 45.7% |
| Immigrants | Serbia | 15.2 /100 | #201 | Poor 45.7% |
| Immigrants | Central America | 14.2 /100 | #202 | Poor 45.7% |
| Alaska Natives | 13.0 /100 | #203 | Poor 45.6% |
| Aleuts | 12.5 /100 | #204 | Poor 45.6% |
| Nepalese | 11.9 /100 | #205 | Poor 45.6% |
| Uruguayans | 10.4 /100 | #206 | Poor 45.5% |
| Immigrants | France | 8.8 /100 | #207 | Tragic 45.4% |
| Hispanics or Latinos | 8.7 /100 | #208 | Tragic 45.4% |
| Immigrants | Uzbekistan | 8.4 /100 | #209 | Tragic 45.4% |
| Cubans | 7.7 /100 | #210 | Tragic 45.4% |
| Immigrants | Spain | 7.3 /100 | #211 | Tragic 45.3% |
| Creek | 6.4 /100 | #212 | Tragic 45.3% |
| Yakama | 5.8 /100 | #213 | Tragic 45.2% |
| Japanese | 5.7 /100 | #214 | Tragic 45.2% |
| Immigrants | Nepal | 5.6 /100 | #215 | Tragic 45.2% |
| Immigrants | Portugal | 5.6 /100 | #216 | Tragic 45.2% |
| Panamanians | 5.5 /100 | #217 | Tragic 45.2% |