Bulgarian vs Bahamian Family Households
COMPARE
Bulgarian
Bahamian
Family Households
Family Households Comparison
Bulgarians
Bahamians
63.6%
FAMILY HOUSEHOLDS
3.4/ 100
METRIC RATING
229th/ 347
METRIC RANK
63.3%
FAMILY HOUSEHOLDS
1.1/ 100
METRIC RATING
252nd/ 347
METRIC RANK
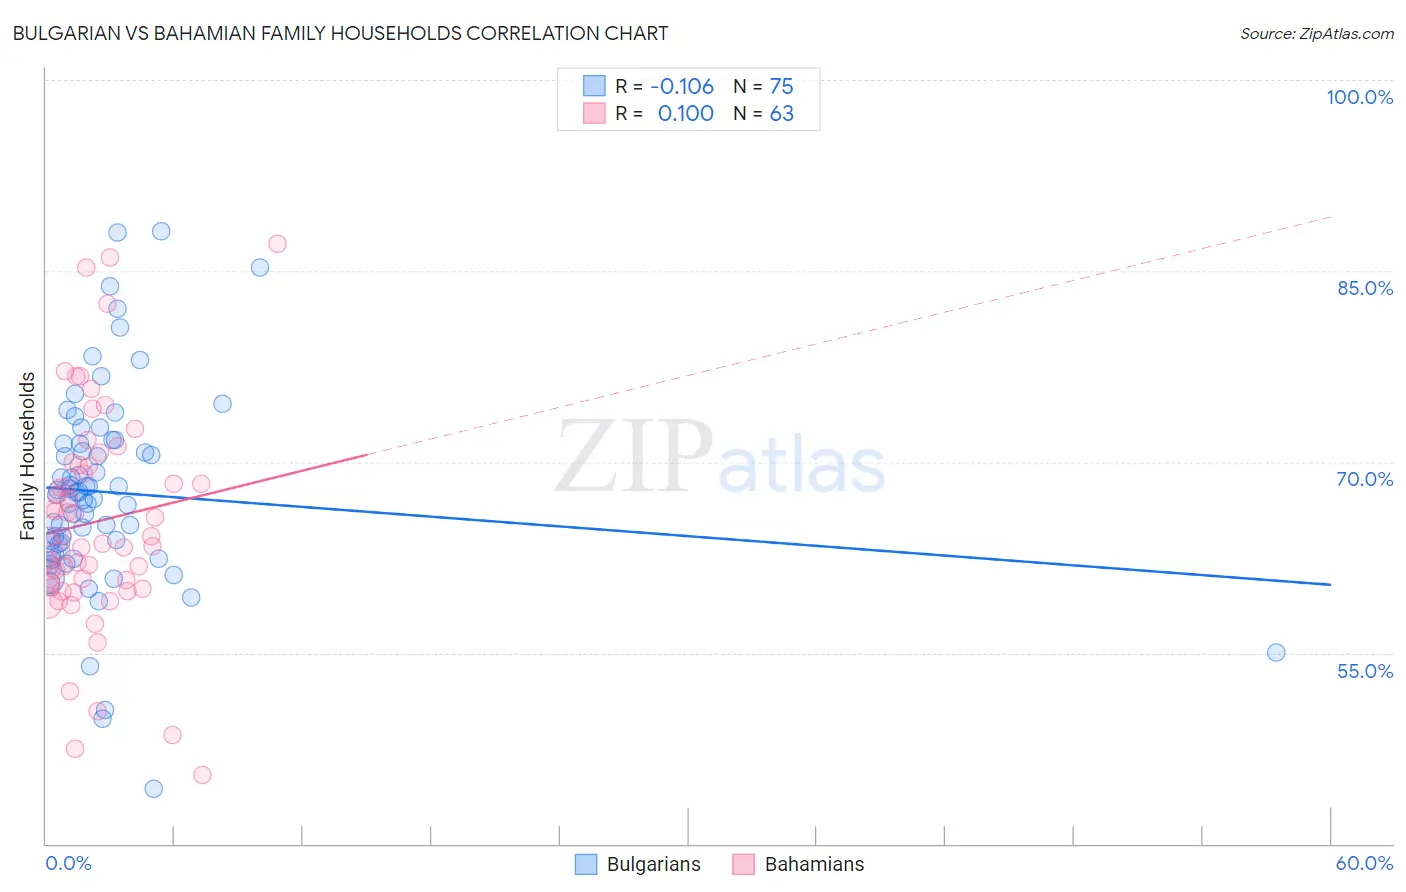
Bulgarian vs Bahamian Family Households Correlation Chart
The statistical analysis conducted on geographies consisting of 205,566,238 people shows a poor negative correlation between the proportion of Bulgarians and percentage of family households in the United States with a correlation coefficient (R) of -0.106 and weighted average of 63.6%. Similarly, the statistical analysis conducted on geographies consisting of 112,635,727 people shows a slight positive correlation between the proportion of Bahamians and percentage of family households in the United States with a correlation coefficient (R) of 0.100 and weighted average of 63.3%, a difference of 0.39%.
Family Households Correlation Summary
| Measurement | Bulgarian | Bahamian |
| Minimum | 44.3% | 45.4% |
| Maximum | 88.1% | 87.2% |
| Range | 43.8% | 41.8% |
| Mean | 67.6% | 65.3% |
| Median | 67.4% | 64.1% |
| Interquartile 25% (IQ1) | 62.8% | 60.1% |
| Interquartile 75% (IQ3) | 71.5% | 69.7% |
| Interquartile Range (IQR) | 8.7% | 9.6% |
| Standard Deviation (Sample) | 8.0% | 8.6% |
| Standard Deviation (Population) | 7.9% | 8.5% |
Similar Demographics by Family Households
Demographics Similar to Bulgarians by Family Households
In terms of family households, the demographic groups most similar to Bulgarians are Blackfeet (63.6%, a difference of 0.020%), Immigrants from Brazil (63.6%, a difference of 0.040%), Immigrants from Greece (63.5%, a difference of 0.060%), Immigrants from Bahamas (63.6%, a difference of 0.070%), and Trinidadian and Tobagonian (63.6%, a difference of 0.070%).
| Demographics | Rating | Rank | Family Households |
| Immigrants | Belarus | 5.5 /100 | #222 | Tragic 63.7% |
| French Canadians | 5.4 /100 | #223 | Tragic 63.7% |
| Turks | 4.5 /100 | #224 | Tragic 63.6% |
| Immigrants | Hungary | 4.3 /100 | #225 | Tragic 63.6% |
| Immigrants | Bahamas | 4.2 /100 | #226 | Tragic 63.6% |
| Trinidadians and Tobagonians | 4.1 /100 | #227 | Tragic 63.6% |
| Blackfeet | 3.6 /100 | #228 | Tragic 63.6% |
| Bulgarians | 3.4 /100 | #229 | Tragic 63.6% |
| Immigrants | Brazil | 3.0 /100 | #230 | Tragic 63.6% |
| Immigrants | Greece | 2.9 /100 | #231 | Tragic 63.5% |
| Immigrants | Northern Africa | 2.6 /100 | #232 | Tragic 63.5% |
| Immigrants | Armenia | 2.6 /100 | #233 | Tragic 63.5% |
| Finns | 2.3 /100 | #234 | Tragic 63.5% |
| Albanians | 2.2 /100 | #235 | Tragic 63.5% |
| Ghanaians | 2.1 /100 | #236 | Tragic 63.5% |
Demographics Similar to Bahamians by Family Households
In terms of family households, the demographic groups most similar to Bahamians are Taiwanese (63.3%, a difference of 0.010%), Immigrants from Dominican Republic (63.3%, a difference of 0.020%), Slovak (63.3%, a difference of 0.030%), Potawatomi (63.3%, a difference of 0.050%), and Immigrants from Japan (63.4%, a difference of 0.070%).
| Demographics | Rating | Rank | Family Households |
| Immigrants | Dominica | 1.6 /100 | #245 | Tragic 63.4% |
| Immigrants | Ghana | 1.6 /100 | #246 | Tragic 63.4% |
| Immigrants | Uzbekistan | 1.5 /100 | #247 | Tragic 63.4% |
| Dominicans | 1.5 /100 | #248 | Tragic 63.4% |
| Russians | 1.4 /100 | #249 | Tragic 63.4% |
| Immigrants | Japan | 1.4 /100 | #250 | Tragic 63.4% |
| Taiwanese | 1.2 /100 | #251 | Tragic 63.3% |
| Bahamians | 1.1 /100 | #252 | Tragic 63.3% |
| Immigrants | Dominican Republic | 1.0 /100 | #253 | Tragic 63.3% |
| Slovaks | 1.0 /100 | #254 | Tragic 63.3% |
| Potawatomi | 1.0 /100 | #255 | Tragic 63.3% |
| Luxembourgers | 0.9 /100 | #256 | Tragic 63.3% |
| Icelanders | 0.8 /100 | #257 | Tragic 63.3% |
| Immigrants | Barbados | 0.7 /100 | #258 | Tragic 63.2% |
| Immigrants | Western Europe | 0.6 /100 | #259 | Tragic 63.2% |