Bulgarian vs Immigrants from Europe Family Households
COMPARE
Bulgarian
Immigrants from Europe
Family Households
Family Households Comparison
Bulgarians
Immigrants from Europe
63.6%
FAMILY HOUSEHOLDS
3.4/ 100
METRIC RATING
229th/ 347
METRIC RANK
63.7%
FAMILY HOUSEHOLDS
6.4/ 100
METRIC RATING
220th/ 347
METRIC RANK
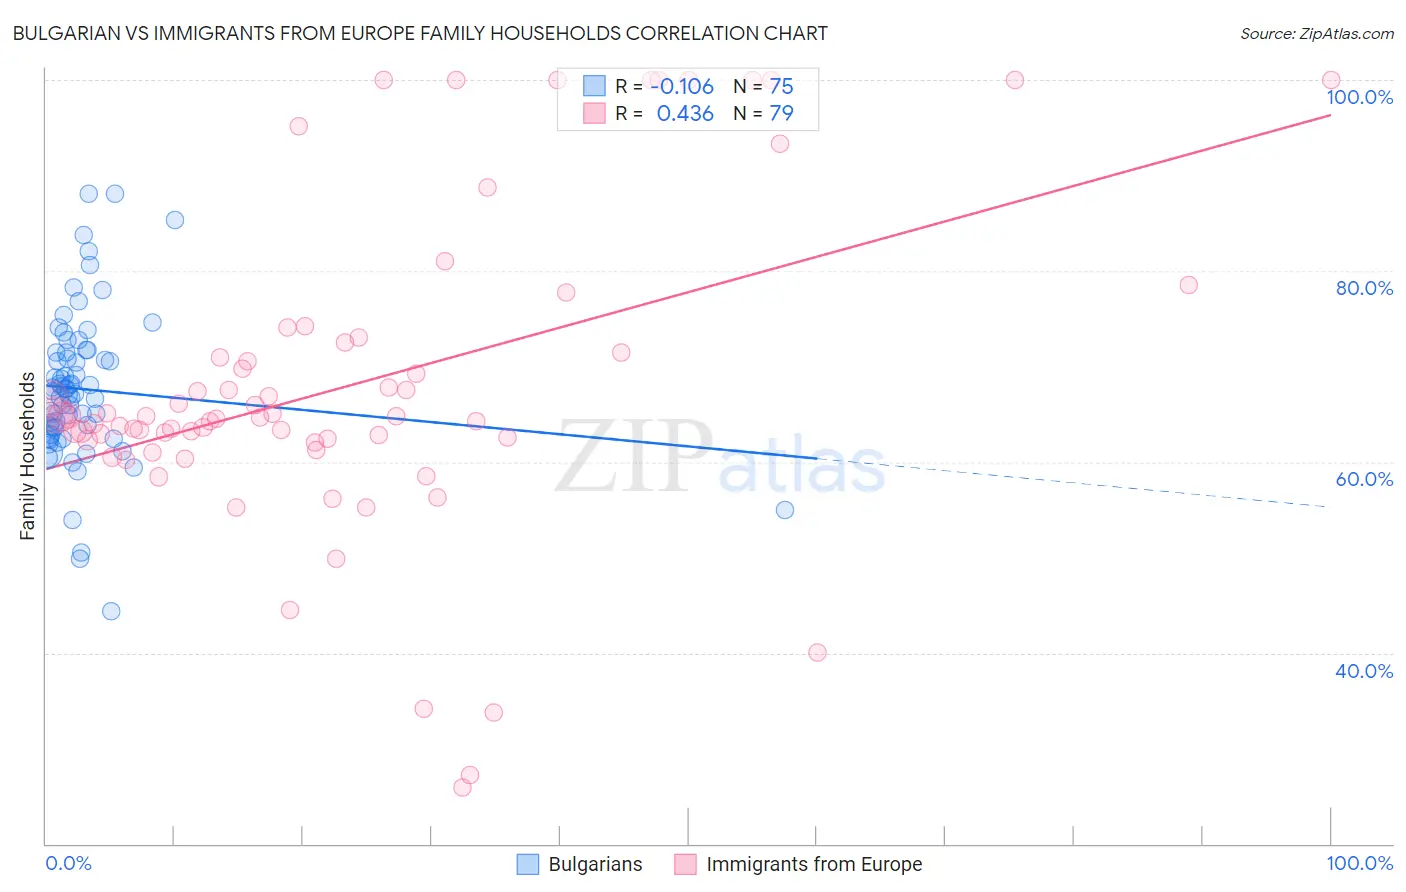
Bulgarian vs Immigrants from Europe Family Households Correlation Chart
The statistical analysis conducted on geographies consisting of 205,566,238 people shows a poor negative correlation between the proportion of Bulgarians and percentage of family households in the United States with a correlation coefficient (R) of -0.106 and weighted average of 63.6%. Similarly, the statistical analysis conducted on geographies consisting of 546,902,993 people shows a moderate positive correlation between the proportion of Immigrants from Europe and percentage of family households in the United States with a correlation coefficient (R) of 0.436 and weighted average of 63.7%, a difference of 0.22%.
Family Households Correlation Summary
| Measurement | Bulgarian | Immigrants from Europe |
| Minimum | 44.3% | 25.9% |
| Maximum | 88.1% | 100.0% |
| Range | 43.8% | 74.1% |
| Mean | 67.6% | 68.1% |
| Median | 67.4% | 64.7% |
| Interquartile 25% (IQ1) | 62.8% | 62.2% |
| Interquartile 75% (IQ3) | 71.5% | 72.5% |
| Interquartile Range (IQR) | 8.7% | 10.2% |
| Standard Deviation (Sample) | 8.0% | 16.6% |
| Standard Deviation (Population) | 7.9% | 16.5% |
Demographics Similar to Bulgarians and Immigrants from Europe by Family Households
In terms of family households, the demographic groups most similar to Bulgarians are Blackfeet (63.6%, a difference of 0.020%), Immigrants from Brazil (63.6%, a difference of 0.040%), Immigrants from Greece (63.5%, a difference of 0.060%), Immigrants from Bahamas (63.6%, a difference of 0.070%), and Trinidadian and Tobagonian (63.6%, a difference of 0.070%). Similarly, the demographic groups most similar to Immigrants from Europe are Macedonian (63.7%, a difference of 0.010%), Immigrants from South Africa (63.7%, a difference of 0.020%), Osage (63.7%, a difference of 0.030%), Marshallese (63.7%, a difference of 0.030%), and Croatian (63.8%, a difference of 0.050%).
| Demographics | Rating | Rank | Family Households |
| Celtics | 8.0 /100 | #214 | Tragic 63.8% |
| Belgians | 7.6 /100 | #215 | Tragic 63.8% |
| Croatians | 7.3 /100 | #216 | Tragic 63.8% |
| Osage | 7.0 /100 | #217 | Tragic 63.7% |
| Marshallese | 6.9 /100 | #218 | Tragic 63.7% |
| Macedonians | 6.5 /100 | #219 | Tragic 63.7% |
| Immigrants | Europe | 6.4 /100 | #220 | Tragic 63.7% |
| Immigrants | South Africa | 5.9 /100 | #221 | Tragic 63.7% |
| Immigrants | Belarus | 5.5 /100 | #222 | Tragic 63.7% |
| French Canadians | 5.4 /100 | #223 | Tragic 63.7% |
| Turks | 4.5 /100 | #224 | Tragic 63.6% |
| Immigrants | Hungary | 4.3 /100 | #225 | Tragic 63.6% |
| Immigrants | Bahamas | 4.2 /100 | #226 | Tragic 63.6% |
| Trinidadians and Tobagonians | 4.1 /100 | #227 | Tragic 63.6% |
| Blackfeet | 3.6 /100 | #228 | Tragic 63.6% |
| Bulgarians | 3.4 /100 | #229 | Tragic 63.6% |
| Immigrants | Brazil | 3.0 /100 | #230 | Tragic 63.6% |
| Immigrants | Greece | 2.9 /100 | #231 | Tragic 63.5% |
| Immigrants | Northern Africa | 2.6 /100 | #232 | Tragic 63.5% |
| Immigrants | Armenia | 2.6 /100 | #233 | Tragic 63.5% |
| Finns | 2.3 /100 | #234 | Tragic 63.5% |