Polish vs Bahamian Family Households
COMPARE
Polish
Bahamian
Family Households
Family Households Comparison
Poles
Bahamians
64.0%
FAMILY HOUSEHOLDS
18.9/ 100
METRIC RATING
198th/ 347
METRIC RANK
63.3%
FAMILY HOUSEHOLDS
1.1/ 100
METRIC RATING
252nd/ 347
METRIC RANK
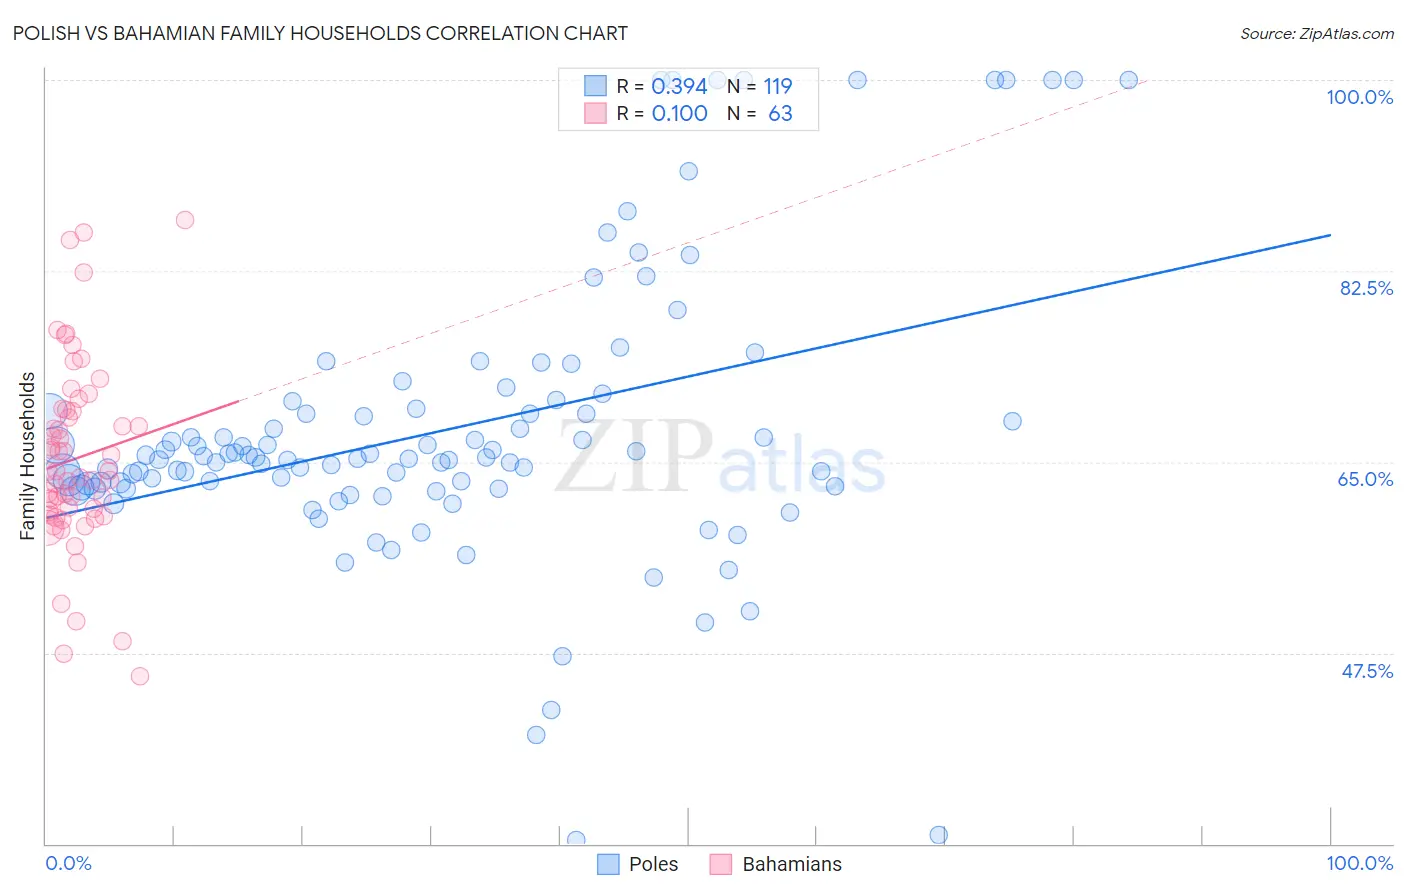
Polish vs Bahamian Family Households Correlation Chart
The statistical analysis conducted on geographies consisting of 559,976,877 people shows a mild positive correlation between the proportion of Poles and percentage of family households in the United States with a correlation coefficient (R) of 0.394 and weighted average of 64.0%. Similarly, the statistical analysis conducted on geographies consisting of 112,635,727 people shows a slight positive correlation between the proportion of Bahamians and percentage of family households in the United States with a correlation coefficient (R) of 0.100 and weighted average of 63.3%, a difference of 1.0%.
Family Households Correlation Summary
| Measurement | Polish | Bahamian |
| Minimum | 30.3% | 45.4% |
| Maximum | 100.0% | 87.2% |
| Range | 69.7% | 41.8% |
| Mean | 68.0% | 65.3% |
| Median | 65.4% | 64.1% |
| Interquartile 25% (IQ1) | 62.7% | 60.1% |
| Interquartile 75% (IQ3) | 69.9% | 69.7% |
| Interquartile Range (IQR) | 7.2% | 9.6% |
| Standard Deviation (Sample) | 13.1% | 8.6% |
| Standard Deviation (Population) | 13.1% | 8.5% |
Similar Demographics by Family Households
Demographics Similar to Poles by Family Households
In terms of family households, the demographic groups most similar to Poles are Seminole (64.0%, a difference of 0.0%), Immigrants from Canada (64.0%, a difference of 0.010%), Slavic (64.0%, a difference of 0.010%), Immigrants from North America (64.0%, a difference of 0.020%), and Immigrants from Malaysia (64.0%, a difference of 0.020%).
| Demographics | Rating | Rank | Family Households |
| Arabs | 24.5 /100 | #191 | Fair 64.1% |
| Lithuanians | 23.8 /100 | #192 | Fair 64.0% |
| French | 23.7 /100 | #193 | Fair 64.0% |
| Paiute | 22.2 /100 | #194 | Fair 64.0% |
| Immigrants | North America | 20.0 /100 | #195 | Poor 64.0% |
| Immigrants | Canada | 19.2 /100 | #196 | Poor 64.0% |
| Seminole | 18.9 /100 | #197 | Poor 64.0% |
| Poles | 18.9 /100 | #198 | Poor 64.0% |
| Slavs | 18.6 /100 | #199 | Poor 64.0% |
| Immigrants | Malaysia | 17.9 /100 | #200 | Poor 64.0% |
| Immigrants | Eastern Europe | 17.2 /100 | #201 | Poor 64.0% |
| Iranians | 13.5 /100 | #202 | Poor 63.9% |
| Norwegians | 13.2 /100 | #203 | Poor 63.9% |
| Immigrants | Uruguay | 12.8 /100 | #204 | Poor 63.9% |
| Brazilians | 12.4 /100 | #205 | Poor 63.9% |
Demographics Similar to Bahamians by Family Households
In terms of family households, the demographic groups most similar to Bahamians are Taiwanese (63.3%, a difference of 0.010%), Immigrants from Dominican Republic (63.3%, a difference of 0.020%), Slovak (63.3%, a difference of 0.030%), Potawatomi (63.3%, a difference of 0.050%), and Immigrants from Japan (63.4%, a difference of 0.070%).
| Demographics | Rating | Rank | Family Households |
| Immigrants | Dominica | 1.6 /100 | #245 | Tragic 63.4% |
| Immigrants | Ghana | 1.6 /100 | #246 | Tragic 63.4% |
| Immigrants | Uzbekistan | 1.5 /100 | #247 | Tragic 63.4% |
| Dominicans | 1.5 /100 | #248 | Tragic 63.4% |
| Russians | 1.4 /100 | #249 | Tragic 63.4% |
| Immigrants | Japan | 1.4 /100 | #250 | Tragic 63.4% |
| Taiwanese | 1.2 /100 | #251 | Tragic 63.3% |
| Bahamians | 1.1 /100 | #252 | Tragic 63.3% |
| Immigrants | Dominican Republic | 1.0 /100 | #253 | Tragic 63.3% |
| Slovaks | 1.0 /100 | #254 | Tragic 63.3% |
| Potawatomi | 1.0 /100 | #255 | Tragic 63.3% |
| Luxembourgers | 0.9 /100 | #256 | Tragic 63.3% |
| Icelanders | 0.8 /100 | #257 | Tragic 63.3% |
| Immigrants | Barbados | 0.7 /100 | #258 | Tragic 63.2% |
| Immigrants | Western Europe | 0.6 /100 | #259 | Tragic 63.2% |