British vs Immigrants from Scotland Married-couple Households
COMPARE
British
Immigrants from Scotland
Married-couple Households
Married-couple Households Comparison
British
Immigrants from Scotland
48.7%
MARRIED-COUPLE HOUSEHOLDS
99.5/ 100
METRIC RATING
47th/ 347
METRIC RANK
49.3%
MARRIED-COUPLE HOUSEHOLDS
99.8/ 100
METRIC RATING
26th/ 347
METRIC RANK
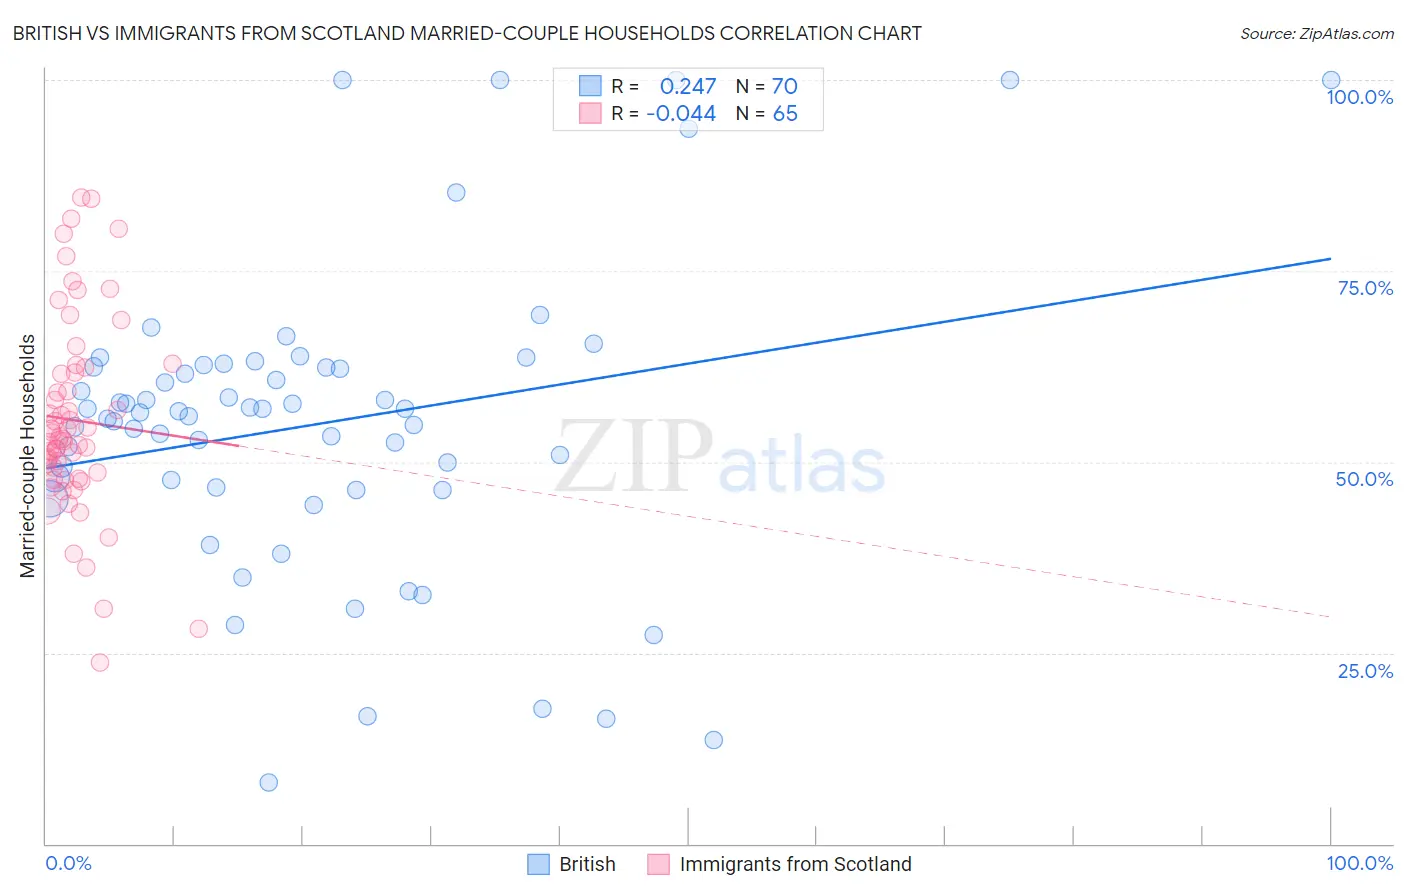
British vs Immigrants from Scotland Married-couple Households Correlation Chart
The statistical analysis conducted on geographies consisting of 530,976,365 people shows a weak positive correlation between the proportion of British and percentage of married-couple family households in the United States with a correlation coefficient (R) of 0.247 and weighted average of 48.7%. Similarly, the statistical analysis conducted on geographies consisting of 196,383,501 people shows no correlation between the proportion of Immigrants from Scotland and percentage of married-couple family households in the United States with a correlation coefficient (R) of -0.044 and weighted average of 49.3%, a difference of 1.1%.
Married-couple Households Correlation Summary
| Measurement | British | Immigrants from Scotland |
| Minimum | 8.1% | 23.8% |
| Maximum | 100.0% | 84.6% |
| Range | 91.9% | 60.9% |
| Mean | 55.0% | 55.5% |
| Median | 56.5% | 53.0% |
| Interquartile 25% (IQ1) | 46.7% | 48.2% |
| Interquartile 75% (IQ3) | 62.4% | 62.1% |
| Interquartile Range (IQR) | 15.8% | 13.9% |
| Standard Deviation (Sample) | 19.7% | 12.8% |
| Standard Deviation (Population) | 19.6% | 12.7% |
Similar Demographics by Married-couple Households
Demographics Similar to British by Married-couple Households
In terms of married-couple households, the demographic groups most similar to British are Tsimshian (48.7%, a difference of 0.020%), Indian (Asian) (48.7%, a difference of 0.050%), Immigrants from Eastern Asia (48.8%, a difference of 0.060%), Welsh (48.8%, a difference of 0.10%), and Immigrants from Sri Lanka (48.7%, a difference of 0.12%).
| Demographics | Rating | Rank | Married-couple Households |
| Immigrants | Bolivia | 99.6 /100 | #40 | Exceptional 48.9% |
| Immigrants | Lebanon | 99.6 /100 | #41 | Exceptional 48.9% |
| Immigrants | Vietnam | 99.6 /100 | #42 | Exceptional 48.8% |
| Immigrants | Iran | 99.6 /100 | #43 | Exceptional 48.8% |
| Welsh | 99.5 /100 | #44 | Exceptional 48.8% |
| Immigrants | Eastern Asia | 99.5 /100 | #45 | Exceptional 48.8% |
| Tsimshian | 99.5 /100 | #46 | Exceptional 48.7% |
| British | 99.5 /100 | #47 | Exceptional 48.7% |
| Indians (Asian) | 99.4 /100 | #48 | Exceptional 48.7% |
| Immigrants | Sri Lanka | 99.4 /100 | #49 | Exceptional 48.7% |
| Samoans | 99.4 /100 | #50 | Exceptional 48.7% |
| Eastern Europeans | 99.3 /100 | #51 | Exceptional 48.6% |
| Irish | 99.3 /100 | #52 | Exceptional 48.6% |
| Whites/Caucasians | 99.3 /100 | #53 | Exceptional 48.6% |
| Immigrants | Lithuania | 99.3 /100 | #54 | Exceptional 48.6% |
Demographics Similar to Immigrants from Scotland by Married-couple Households
In terms of married-couple households, the demographic groups most similar to Immigrants from Scotland are Bhutanese (49.3%, a difference of 0.020%), Immigrants from Philippines (49.3%, a difference of 0.13%), German (49.2%, a difference of 0.21%), Maltese (49.2%, a difference of 0.22%), and Bolivian (49.2%, a difference of 0.23%).
| Demographics | Rating | Rank | Married-couple Households |
| Europeans | 99.9 /100 | #19 | Exceptional 49.6% |
| Scandinavians | 99.9 /100 | #20 | Exceptional 49.6% |
| Norwegians | 99.9 /100 | #21 | Exceptional 49.5% |
| Asians | 99.9 /100 | #22 | Exceptional 49.5% |
| Dutch | 99.9 /100 | #23 | Exceptional 49.5% |
| Czechs | 99.9 /100 | #24 | Exceptional 49.4% |
| Immigrants | Philippines | 99.9 /100 | #25 | Exceptional 49.3% |
| Immigrants | Scotland | 99.8 /100 | #26 | Exceptional 49.3% |
| Bhutanese | 99.8 /100 | #27 | Exceptional 49.3% |
| Germans | 99.8 /100 | #28 | Exceptional 49.2% |
| Maltese | 99.8 /100 | #29 | Exceptional 49.2% |
| Bolivians | 99.8 /100 | #30 | Exceptional 49.2% |
| Native Hawaiians | 99.8 /100 | #31 | Exceptional 49.1% |
| Hungarians | 99.8 /100 | #32 | Exceptional 49.1% |
| Immigrants | Asia | 99.7 /100 | #33 | Exceptional 49.1% |