Hawaiian vs Immigrants from Scotland Married-couple Households
COMPARE
Hawaiian
Immigrants from Scotland
Married-couple Households
Married-couple Households Comparison
Hawaiians
Immigrants from Scotland
47.8%
MARRIED-COUPLE HOUSEHOLDS
96.0/ 100
METRIC RATING
103rd/ 347
METRIC RANK
49.3%
MARRIED-COUPLE HOUSEHOLDS
99.8/ 100
METRIC RATING
26th/ 347
METRIC RANK
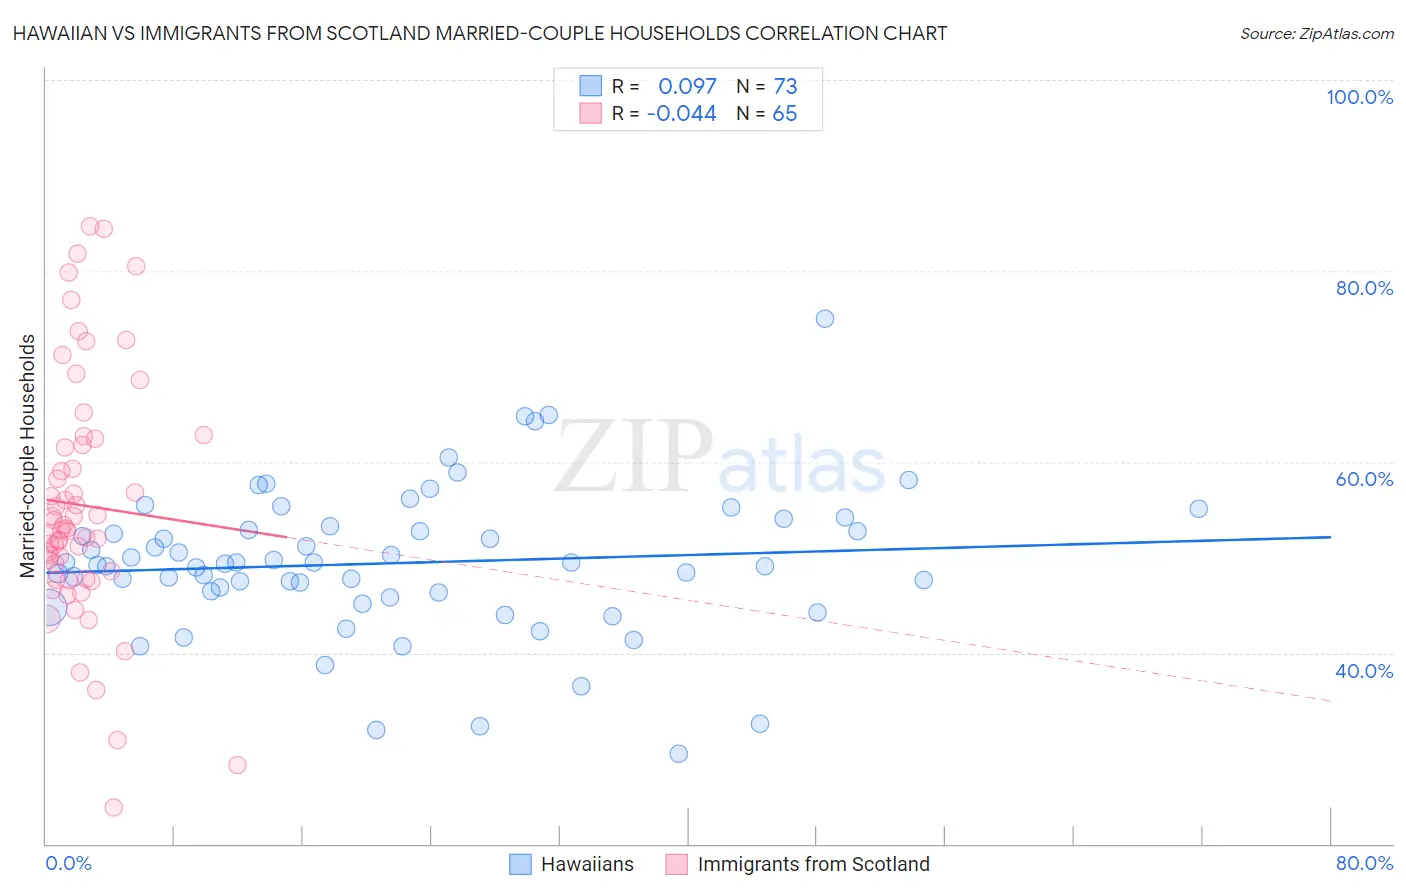
Hawaiian vs Immigrants from Scotland Married-couple Households Correlation Chart
The statistical analysis conducted on geographies consisting of 327,384,536 people shows a slight positive correlation between the proportion of Hawaiians and percentage of married-couple family households in the United States with a correlation coefficient (R) of 0.097 and weighted average of 47.8%. Similarly, the statistical analysis conducted on geographies consisting of 196,383,501 people shows no correlation between the proportion of Immigrants from Scotland and percentage of married-couple family households in the United States with a correlation coefficient (R) of -0.044 and weighted average of 49.3%, a difference of 3.0%.
Married-couple Households Correlation Summary
| Measurement | Hawaiian | Immigrants from Scotland |
| Minimum | 29.5% | 23.8% |
| Maximum | 75.0% | 84.6% |
| Range | 45.5% | 60.9% |
| Mean | 49.4% | 55.5% |
| Median | 49.3% | 53.0% |
| Interquartile 25% (IQ1) | 46.0% | 48.2% |
| Interquartile 75% (IQ3) | 53.0% | 62.1% |
| Interquartile Range (IQR) | 7.0% | 13.9% |
| Standard Deviation (Sample) | 7.7% | 12.8% |
| Standard Deviation (Population) | 7.7% | 12.7% |
Similar Demographics by Married-couple Households
Demographics Similar to Hawaiians by Married-couple Households
In terms of married-couple households, the demographic groups most similar to Hawaiians are Slavic (47.8%, a difference of 0.0%), Immigrants from South Africa (47.8%, a difference of 0.010%), Turkish (47.8%, a difference of 0.020%), Immigrants from Italy (47.9%, a difference of 0.080%), and Immigrants from Austria (47.9%, a difference of 0.090%).
| Demographics | Rating | Rank | Married-couple Households |
| Immigrants | Egypt | 96.6 /100 | #96 | Exceptional 47.9% |
| Latvians | 96.5 /100 | #97 | Exceptional 47.9% |
| Immigrants | North Macedonia | 96.4 /100 | #98 | Exceptional 47.9% |
| Immigrants | Austria | 96.4 /100 | #99 | Exceptional 47.9% |
| Immigrants | Italy | 96.3 /100 | #100 | Exceptional 47.9% |
| Turks | 96.1 /100 | #101 | Exceptional 47.8% |
| Slavs | 96.0 /100 | #102 | Exceptional 47.8% |
| Hawaiians | 96.0 /100 | #103 | Exceptional 47.8% |
| Immigrants | South Africa | 96.0 /100 | #104 | Exceptional 47.8% |
| Immigrants | Czechoslovakia | 95.5 /100 | #105 | Exceptional 47.8% |
| Portuguese | 95.5 /100 | #106 | Exceptional 47.8% |
| Estonians | 94.7 /100 | #107 | Exceptional 47.7% |
| Immigrants | Japan | 94.4 /100 | #108 | Exceptional 47.7% |
| Immigrants | Jordan | 94.1 /100 | #109 | Exceptional 47.7% |
| Macedonians | 93.9 /100 | #110 | Exceptional 47.6% |
Demographics Similar to Immigrants from Scotland by Married-couple Households
In terms of married-couple households, the demographic groups most similar to Immigrants from Scotland are Bhutanese (49.3%, a difference of 0.020%), Immigrants from Philippines (49.3%, a difference of 0.13%), German (49.2%, a difference of 0.21%), Maltese (49.2%, a difference of 0.22%), and Bolivian (49.2%, a difference of 0.23%).
| Demographics | Rating | Rank | Married-couple Households |
| Europeans | 99.9 /100 | #19 | Exceptional 49.6% |
| Scandinavians | 99.9 /100 | #20 | Exceptional 49.6% |
| Norwegians | 99.9 /100 | #21 | Exceptional 49.5% |
| Asians | 99.9 /100 | #22 | Exceptional 49.5% |
| Dutch | 99.9 /100 | #23 | Exceptional 49.5% |
| Czechs | 99.9 /100 | #24 | Exceptional 49.4% |
| Immigrants | Philippines | 99.9 /100 | #25 | Exceptional 49.3% |
| Immigrants | Scotland | 99.8 /100 | #26 | Exceptional 49.3% |
| Bhutanese | 99.8 /100 | #27 | Exceptional 49.3% |
| Germans | 99.8 /100 | #28 | Exceptional 49.2% |
| Maltese | 99.8 /100 | #29 | Exceptional 49.2% |
| Bolivians | 99.8 /100 | #30 | Exceptional 49.2% |
| Native Hawaiians | 99.8 /100 | #31 | Exceptional 49.1% |
| Hungarians | 99.8 /100 | #32 | Exceptional 49.1% |
| Immigrants | Asia | 99.7 /100 | #33 | Exceptional 49.1% |