Italian vs Welsh Family Households with Children
COMPARE
Italian
Welsh
Family Households with Children
Family Households with Children Comparison
Italians
Welsh
26.8%
FAMILY HOUSEHOLDS WITH CHILDREN
1.5/ 100
METRIC RATING
253rd/ 347
METRIC RANK
27.2%
FAMILY HOUSEHOLDS WITH CHILDREN
14.2/ 100
METRIC RATING
211th/ 347
METRIC RANK
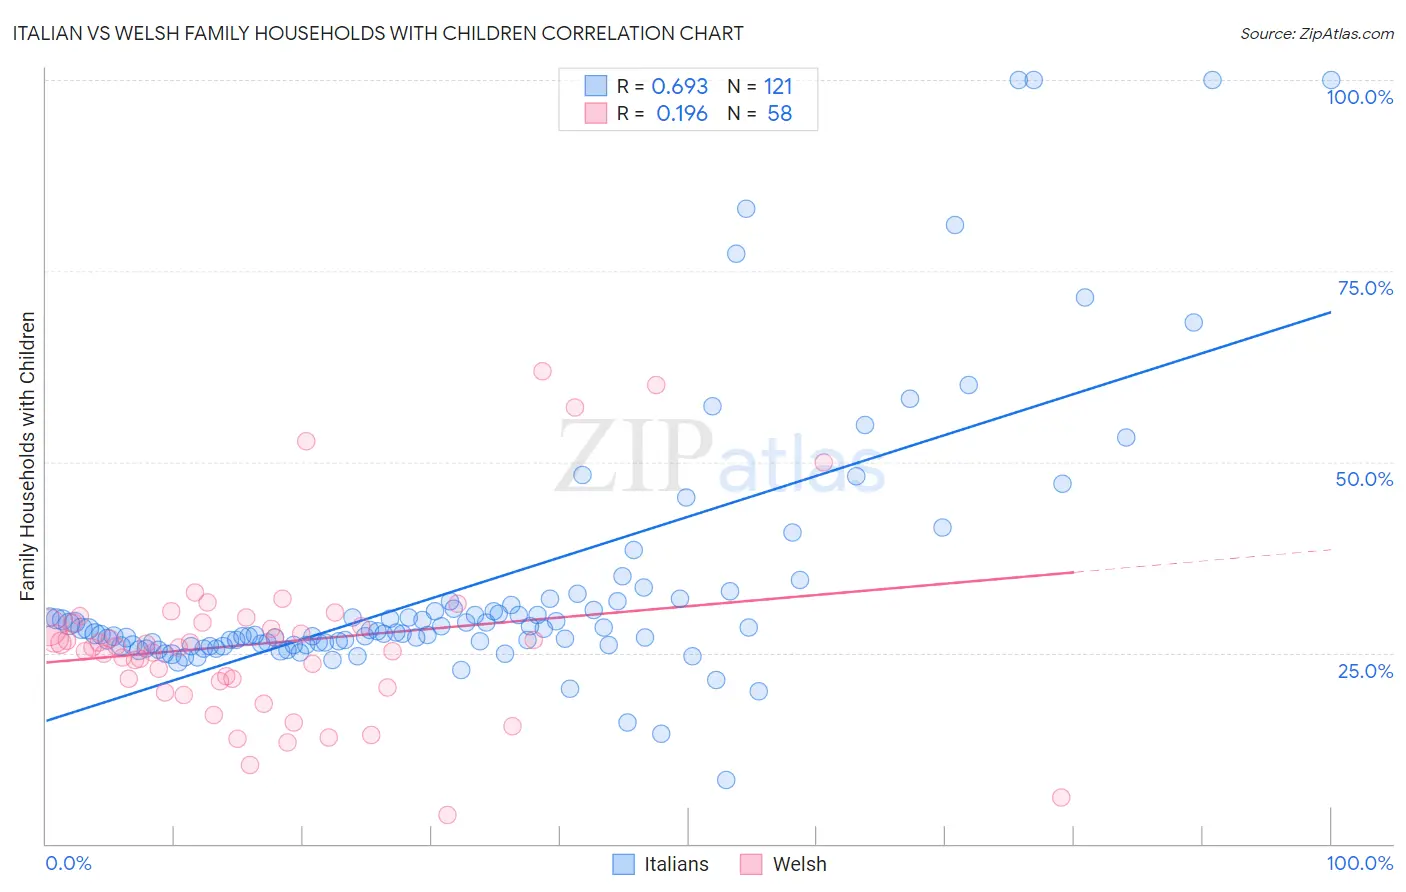
Italian vs Welsh Family Households with Children Correlation Chart
The statistical analysis conducted on geographies consisting of 573,982,396 people shows a significant positive correlation between the proportion of Italians and percentage of family households with children in the United States with a correlation coefficient (R) of 0.693 and weighted average of 26.8%. Similarly, the statistical analysis conducted on geographies consisting of 527,895,960 people shows a poor positive correlation between the proportion of Welsh and percentage of family households with children in the United States with a correlation coefficient (R) of 0.196 and weighted average of 27.2%, a difference of 1.3%.
Family Households with Children Correlation Summary
| Measurement | Italian | Welsh |
| Minimum | 8.3% | 3.8% |
| Maximum | 100.0% | 61.8% |
| Range | 91.7% | 58.0% |
| Mean | 33.8% | 26.3% |
| Median | 27.7% | 25.8% |
| Interquartile 25% (IQ1) | 26.0% | 21.2% |
| Interquartile 75% (IQ3) | 31.4% | 28.9% |
| Interquartile Range (IQR) | 5.4% | 7.7% |
| Standard Deviation (Sample) | 17.3% | 11.3% |
| Standard Deviation (Population) | 17.3% | 11.2% |
Similar Demographics by Family Households with Children
Demographics Similar to Italians by Family Households with Children
In terms of family households with children, the demographic groups most similar to Italians are Immigrants from Scotland (26.8%, a difference of 0.030%), German Russian (26.8%, a difference of 0.030%), Scotch-Irish (26.8%, a difference of 0.050%), Irish (26.8%, a difference of 0.080%), and Slavic (26.8%, a difference of 0.090%).
| Demographics | Rating | Rank | Family Households with Children |
| Jamaicans | 2.5 /100 | #246 | Tragic 26.9% |
| Potawatomi | 2.2 /100 | #247 | Tragic 26.9% |
| Immigrants | Kazakhstan | 2.2 /100 | #248 | Tragic 26.9% |
| Immigrants | Eastern Europe | 2.1 /100 | #249 | Tragic 26.9% |
| Belgians | 2.1 /100 | #250 | Tragic 26.9% |
| Immigrants | Bosnia and Herzegovina | 1.9 /100 | #251 | Tragic 26.8% |
| Irish | 1.8 /100 | #252 | Tragic 26.8% |
| Italians | 1.5 /100 | #253 | Tragic 26.8% |
| Immigrants | Scotland | 1.5 /100 | #254 | Tragic 26.8% |
| German Russians | 1.5 /100 | #255 | Tragic 26.8% |
| Scotch-Irish | 1.4 /100 | #256 | Tragic 26.8% |
| Slavs | 1.3 /100 | #257 | Tragic 26.8% |
| Immigrants | Cuba | 1.3 /100 | #258 | Tragic 26.8% |
| Immigrants | Lithuania | 1.2 /100 | #259 | Tragic 26.8% |
| Immigrants | Jamaica | 1.2 /100 | #260 | Tragic 26.8% |
Demographics Similar to Welsh by Family Households with Children
In terms of family households with children, the demographic groups most similar to Welsh are Immigrants from Ukraine (27.2%, a difference of 0.010%), Immigrants from Dominica (27.2%, a difference of 0.010%), Okinawan (27.2%, a difference of 0.020%), African (27.2%, a difference of 0.060%), and Northern European (27.2%, a difference of 0.060%).
| Demographics | Rating | Rank | Family Households with Children |
| Immigrants | Sudan | 21.6 /100 | #204 | Fair 27.3% |
| Immigrants | Haiti | 20.3 /100 | #205 | Fair 27.2% |
| Immigrants | Micronesia | 20.2 /100 | #206 | Fair 27.2% |
| Haitians | 19.8 /100 | #207 | Poor 27.2% |
| Immigrants | Poland | 16.4 /100 | #208 | Poor 27.2% |
| Dutch West Indians | 15.8 /100 | #209 | Poor 27.2% |
| Immigrants | Ukraine | 14.4 /100 | #210 | Poor 27.2% |
| Welsh | 14.2 /100 | #211 | Poor 27.2% |
| Immigrants | Dominica | 13.9 /100 | #212 | Poor 27.2% |
| Okinawans | 13.7 /100 | #213 | Poor 27.2% |
| Africans | 13.0 /100 | #214 | Poor 27.2% |
| Northern Europeans | 12.8 /100 | #215 | Poor 27.2% |
| Cubans | 12.2 /100 | #216 | Poor 27.1% |
| U.S. Virgin Islanders | 12.1 /100 | #217 | Poor 27.1% |
| Greeks | 11.4 /100 | #218 | Poor 27.1% |