Black/African American vs Immigrants from Serbia Births to Unmarried Women
COMPARE
Black/African American
Immigrants from Serbia
Births to Unmarried Women
Births to Unmarried Women Comparison
Blacks/African Americans
Immigrants from Serbia
44.3%
BIRTHS TO UNMARRIED WOMEN
0.0/ 100
METRIC RATING
333rd/ 347
METRIC RANK
28.3%
BIRTHS TO UNMARRIED WOMEN
98.9/ 100
METRIC RATING
63rd/ 347
METRIC RANK
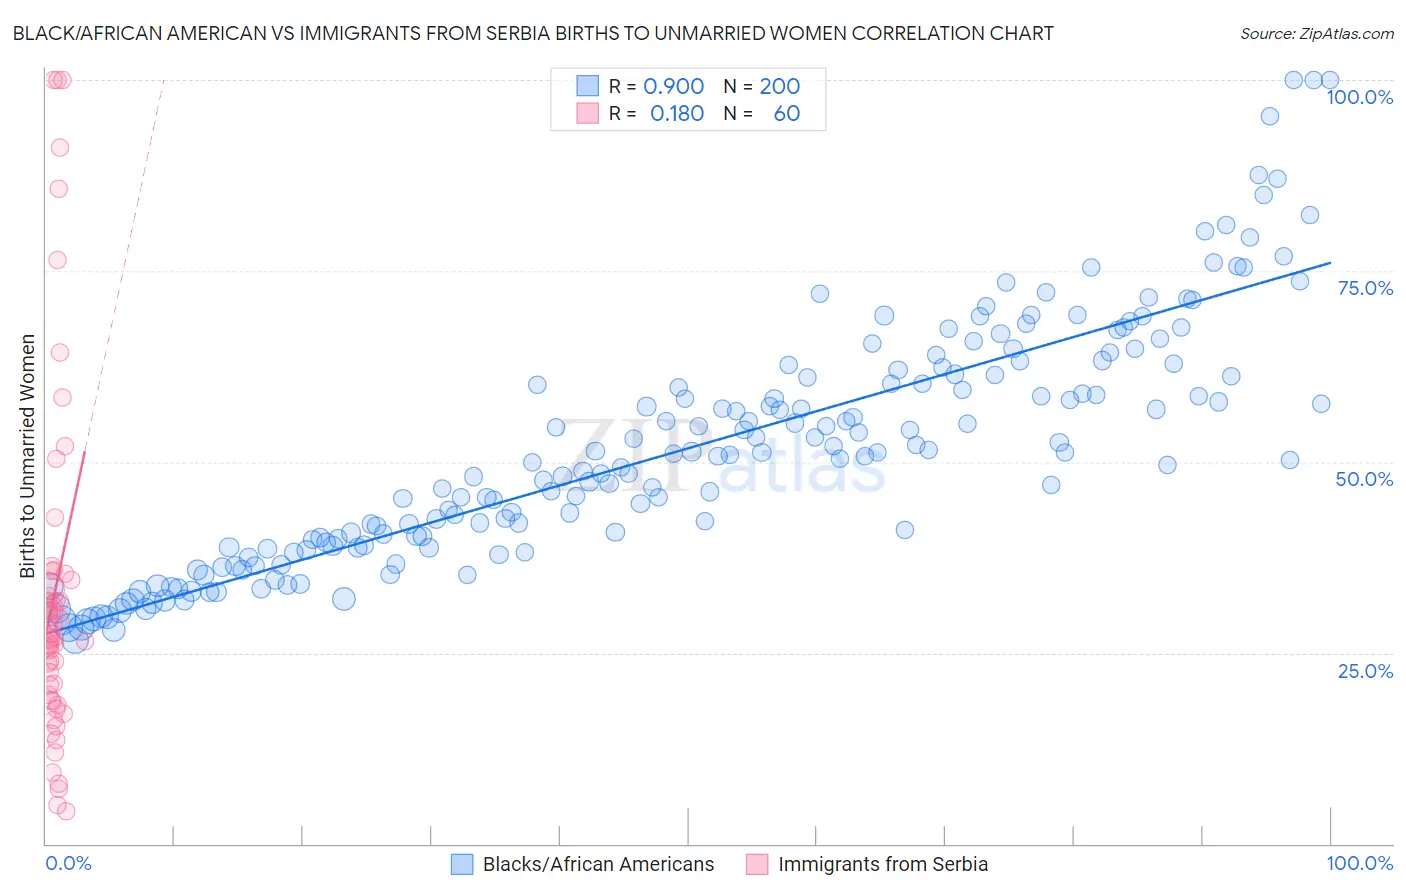
Black/African American vs Immigrants from Serbia Births to Unmarried Women Correlation Chart
The statistical analysis conducted on geographies consisting of 506,152,506 people shows a very strong positive correlation between the proportion of Blacks/African Americans and percentage of births to unmarried women in the United States with a correlation coefficient (R) of 0.900 and weighted average of 44.3%. Similarly, the statistical analysis conducted on geographies consisting of 126,646,358 people shows a poor positive correlation between the proportion of Immigrants from Serbia and percentage of births to unmarried women in the United States with a correlation coefficient (R) of 0.180 and weighted average of 28.3%, a difference of 56.7%.
Births to Unmarried Women Correlation Summary
| Measurement | Black/African American | Immigrants from Serbia |
| Minimum | 26.7% | 4.2% |
| Maximum | 100.0% | 100.0% |
| Range | 73.3% | 95.8% |
| Mean | 51.8% | 33.1% |
| Median | 50.9% | 27.0% |
| Interquartile 25% (IQ1) | 39.1% | 19.1% |
| Interquartile 75% (IQ3) | 61.4% | 35.0% |
| Interquartile Range (IQR) | 22.4% | 15.8% |
| Standard Deviation (Sample) | 15.6% | 23.2% |
| Standard Deviation (Population) | 15.6% | 23.0% |
Similar Demographics by Births to Unmarried Women
Demographics Similar to Blacks/African Americans by Births to Unmarried Women
In terms of births to unmarried women, the demographic groups most similar to Blacks/African Americans are Yuman (44.4%, a difference of 0.17%), Colville (45.3%, a difference of 2.3%), Kiowa (43.1%, a difference of 2.7%), Native/Alaskan (43.0%, a difference of 3.0%), and Puerto Rican (45.7%, a difference of 3.1%).
| Demographics | Rating | Rank | Births to Unmarried Women |
| Immigrants | Cuba | 0.0 /100 | #326 | Tragic 41.5% |
| Tsimshian | 0.0 /100 | #327 | Tragic 42.2% |
| Immigrants | Cabo Verde | 0.0 /100 | #328 | Tragic 42.2% |
| Paiute | 0.0 /100 | #329 | Tragic 42.5% |
| Chippewa | 0.0 /100 | #330 | Tragic 42.6% |
| Natives/Alaskans | 0.0 /100 | #331 | Tragic 43.0% |
| Kiowa | 0.0 /100 | #332 | Tragic 43.1% |
| Blacks/African Americans | 0.0 /100 | #333 | Tragic 44.3% |
| Yuman | 0.0 /100 | #334 | Tragic 44.4% |
| Colville | 0.0 /100 | #335 | Tragic 45.3% |
| Puerto Ricans | 0.0 /100 | #336 | Tragic 45.7% |
| Houma | 0.0 /100 | #337 | Tragic 46.6% |
| Arapaho | 0.0 /100 | #338 | Tragic 47.1% |
| Lumbee | 0.0 /100 | #339 | Tragic 48.2% |
| Tohono O'odham | 0.0 /100 | #340 | Tragic 49.8% |
Demographics Similar to Immigrants from Serbia by Births to Unmarried Women
In terms of births to unmarried women, the demographic groups most similar to Immigrants from Serbia are Egyptian (28.2%, a difference of 0.14%), Tongan (28.4%, a difference of 0.38%), Immigrants from Czechoslovakia (28.4%, a difference of 0.40%), Immigrants from Egypt (28.4%, a difference of 0.42%), and Immigrants from North Macedonia (28.1%, a difference of 0.46%).
| Demographics | Rating | Rank | Births to Unmarried Women |
| Immigrants | Belgium | 99.3 /100 | #56 | Exceptional 28.0% |
| Russians | 99.2 /100 | #57 | Exceptional 28.0% |
| Immigrants | Albania | 99.2 /100 | #58 | Exceptional 28.0% |
| Immigrants | Kazakhstan | 99.1 /100 | #59 | Exceptional 28.1% |
| Immigrants | Turkey | 99.1 /100 | #60 | Exceptional 28.1% |
| Immigrants | North Macedonia | 99.1 /100 | #61 | Exceptional 28.1% |
| Egyptians | 99.0 /100 | #62 | Exceptional 28.2% |
| Immigrants | Serbia | 98.9 /100 | #63 | Exceptional 28.3% |
| Tongans | 98.8 /100 | #64 | Exceptional 28.4% |
| Immigrants | Czechoslovakia | 98.8 /100 | #65 | Exceptional 28.4% |
| Immigrants | Egypt | 98.8 /100 | #66 | Exceptional 28.4% |
| Palestinians | 98.7 /100 | #67 | Exceptional 28.4% |
| Immigrants | Europe | 98.7 /100 | #68 | Exceptional 28.4% |
| Bolivians | 98.7 /100 | #69 | Exceptional 28.5% |
| Laotians | 98.6 /100 | #70 | Exceptional 28.5% |