Black/African American vs Panamanian Births to Unmarried Women
COMPARE
Black/African American
Panamanian
Births to Unmarried Women
Births to Unmarried Women Comparison
Blacks/African Americans
Panamanians
44.3%
BIRTHS TO UNMARRIED WOMEN
0.0/ 100
METRIC RATING
333rd/ 347
METRIC RANK
34.2%
BIRTHS TO UNMARRIED WOMEN
3.3/ 100
METRIC RATING
228th/ 347
METRIC RANK
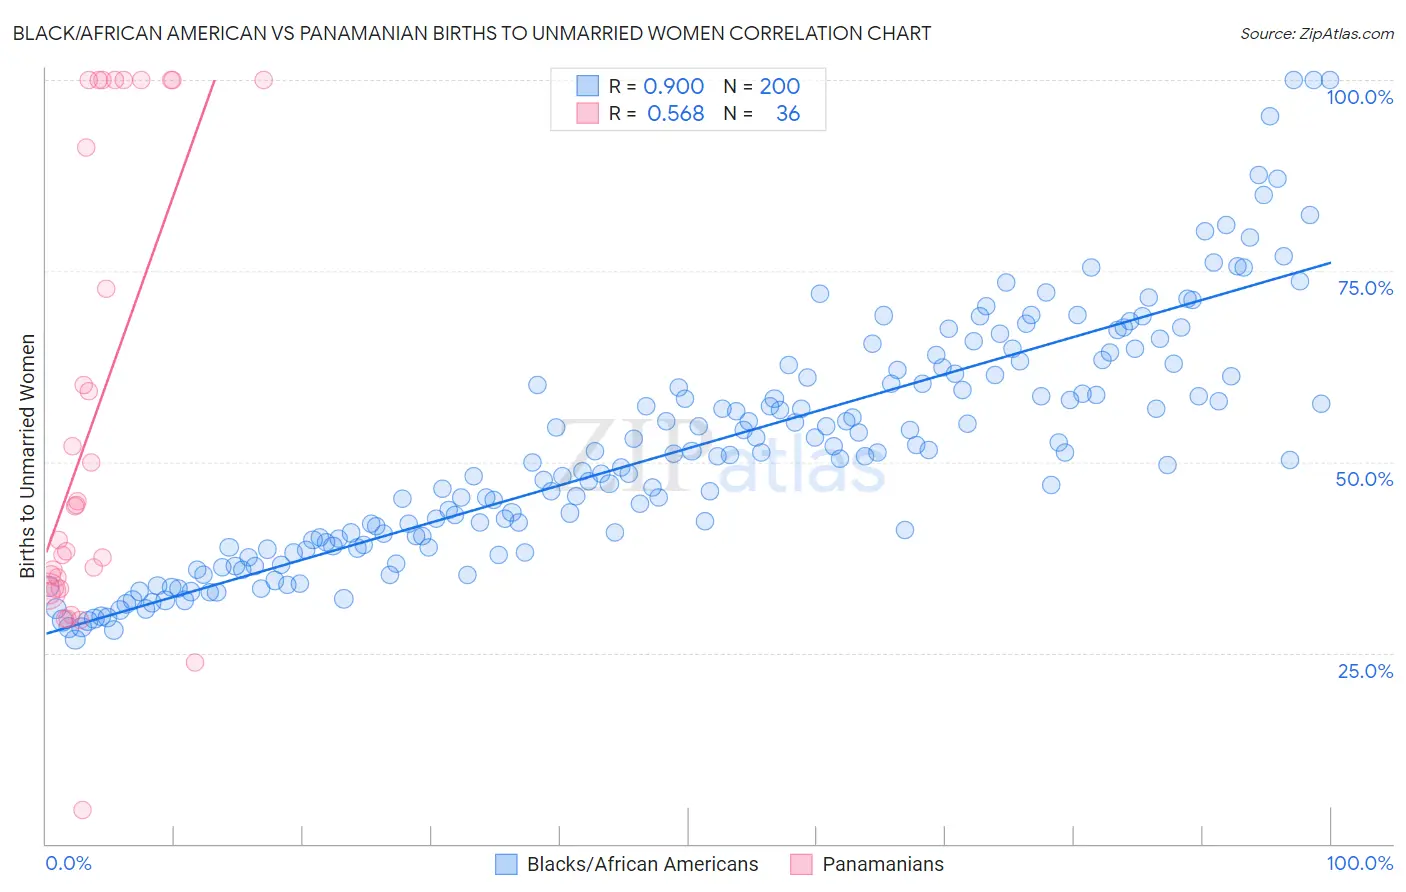
Black/African American vs Panamanian Births to Unmarried Women Correlation Chart
The statistical analysis conducted on geographies consisting of 506,152,506 people shows a very strong positive correlation between the proportion of Blacks/African Americans and percentage of births to unmarried women in the United States with a correlation coefficient (R) of 0.900 and weighted average of 44.3%. Similarly, the statistical analysis conducted on geographies consisting of 269,712,118 people shows a substantial positive correlation between the proportion of Panamanians and percentage of births to unmarried women in the United States with a correlation coefficient (R) of 0.568 and weighted average of 34.2%, a difference of 29.5%.
Births to Unmarried Women Correlation Summary
| Measurement | Black/African American | Panamanian |
| Minimum | 26.7% | 4.5% |
| Maximum | 100.0% | 100.0% |
| Range | 73.3% | 95.5% |
| Mean | 51.8% | 55.4% |
| Median | 50.9% | 42.0% |
| Interquartile 25% (IQ1) | 39.1% | 33.4% |
| Interquartile 75% (IQ3) | 61.4% | 95.6% |
| Interquartile Range (IQR) | 22.4% | 62.2% |
| Standard Deviation (Sample) | 15.6% | 29.7% |
| Standard Deviation (Population) | 15.6% | 29.3% |
Similar Demographics by Births to Unmarried Women
Demographics Similar to Blacks/African Americans by Births to Unmarried Women
In terms of births to unmarried women, the demographic groups most similar to Blacks/African Americans are Yuman (44.4%, a difference of 0.17%), Colville (45.3%, a difference of 2.3%), Kiowa (43.1%, a difference of 2.7%), Native/Alaskan (43.0%, a difference of 3.0%), and Puerto Rican (45.7%, a difference of 3.1%).
| Demographics | Rating | Rank | Births to Unmarried Women |
| Immigrants | Cuba | 0.0 /100 | #326 | Tragic 41.5% |
| Tsimshian | 0.0 /100 | #327 | Tragic 42.2% |
| Immigrants | Cabo Verde | 0.0 /100 | #328 | Tragic 42.2% |
| Paiute | 0.0 /100 | #329 | Tragic 42.5% |
| Chippewa | 0.0 /100 | #330 | Tragic 42.6% |
| Natives/Alaskans | 0.0 /100 | #331 | Tragic 43.0% |
| Kiowa | 0.0 /100 | #332 | Tragic 43.1% |
| Blacks/African Americans | 0.0 /100 | #333 | Tragic 44.3% |
| Yuman | 0.0 /100 | #334 | Tragic 44.4% |
| Colville | 0.0 /100 | #335 | Tragic 45.3% |
| Puerto Ricans | 0.0 /100 | #336 | Tragic 45.7% |
| Houma | 0.0 /100 | #337 | Tragic 46.6% |
| Arapaho | 0.0 /100 | #338 | Tragic 47.1% |
| Lumbee | 0.0 /100 | #339 | Tragic 48.2% |
| Tohono O'odham | 0.0 /100 | #340 | Tragic 49.8% |
Demographics Similar to Panamanians by Births to Unmarried Women
In terms of births to unmarried women, the demographic groups most similar to Panamanians are Immigrants from Panama (34.2%, a difference of 0.030%), Delaware (34.2%, a difference of 0.050%), Immigrants from Sierra Leone (34.2%, a difference of 0.11%), Ghanaian (34.3%, a difference of 0.13%), and Native Hawaiian (34.3%, a difference of 0.28%).
| Demographics | Rating | Rank | Births to Unmarried Women |
| Malaysians | 5.0 /100 | #221 | Tragic 33.9% |
| Immigrants | Uruguay | 4.8 /100 | #222 | Tragic 33.9% |
| Pennsylvania Germans | 4.3 /100 | #223 | Tragic 34.0% |
| Immigrants | Laos | 4.3 /100 | #224 | Tragic 34.0% |
| Spanish | 4.0 /100 | #225 | Tragic 34.1% |
| Delaware | 3.3 /100 | #226 | Tragic 34.2% |
| Immigrants | Panama | 3.3 /100 | #227 | Tragic 34.2% |
| Panamanians | 3.3 /100 | #228 | Tragic 34.2% |
| Immigrants | Sierra Leone | 3.1 /100 | #229 | Tragic 34.2% |
| Ghanaians | 3.1 /100 | #230 | Tragic 34.3% |
| Native Hawaiians | 2.9 /100 | #231 | Tragic 34.3% |
| French Canadians | 2.5 /100 | #232 | Tragic 34.4% |
| Bangladeshis | 2.5 /100 | #233 | Tragic 34.4% |
| Immigrants | Zaire | 2.3 /100 | #234 | Tragic 34.5% |
| Immigrants | Ghana | 2.2 /100 | #235 | Tragic 34.5% |