Black/African American vs Immigrants from Serbia Unemployment Among Ages 55 to 59 years
COMPARE
Black/African American
Immigrants from Serbia
Unemployment Among Ages 55 to 59 years
Unemployment Among Ages 55 to 59 years Comparison
Blacks/African Americans
Immigrants from Serbia
5.5%
UNEMPLOYMENT AMONG AGES 55 TO 59 YEARS
0.0/ 100
METRIC RATING
304th/ 347
METRIC RANK
4.7%
UNEMPLOYMENT AMONG AGES 55 TO 59 YEARS
87.8/ 100
METRIC RATING
126th/ 347
METRIC RANK
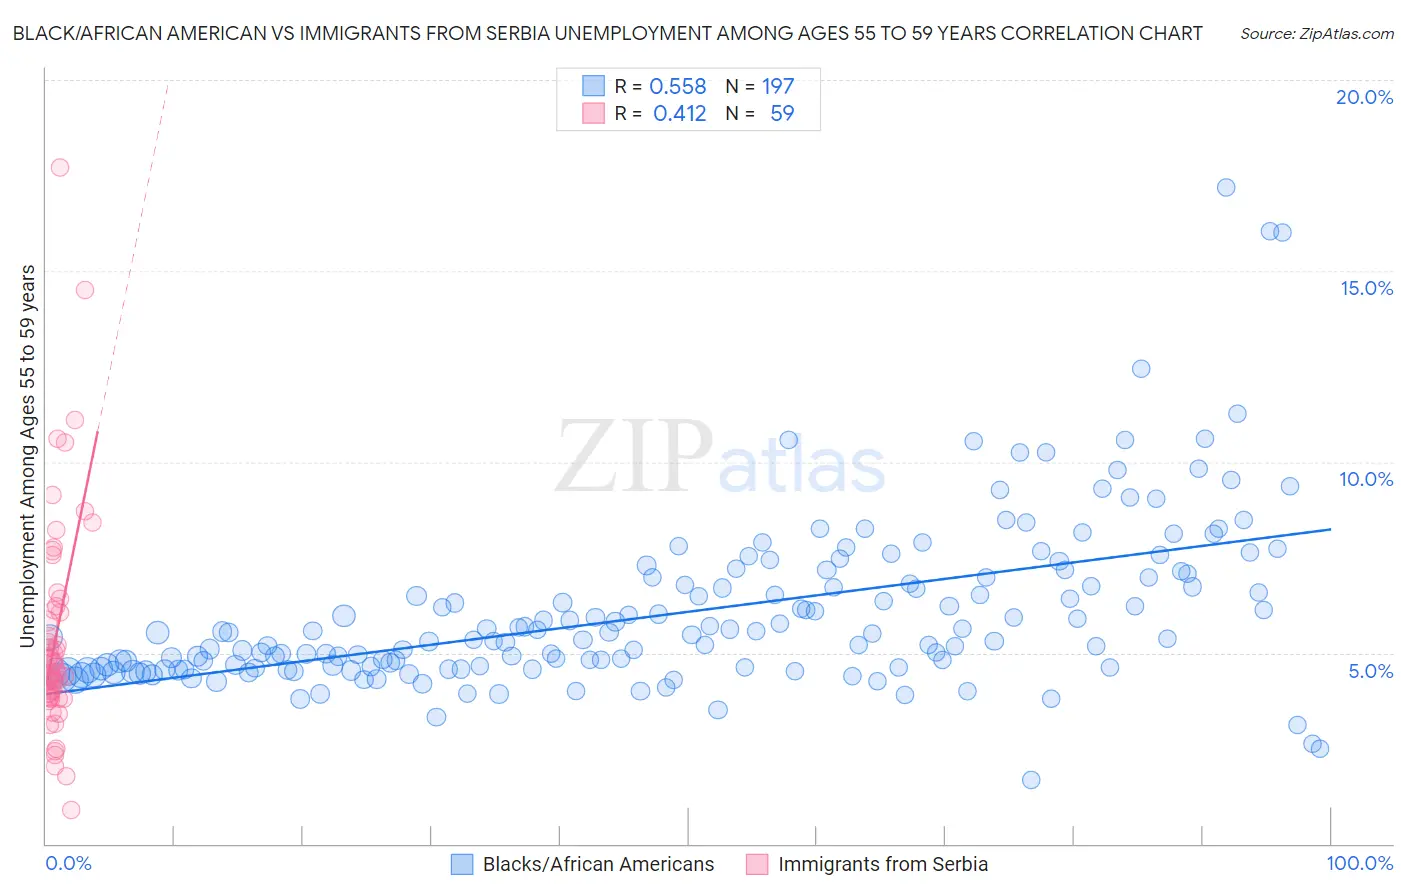
Black/African American vs Immigrants from Serbia Unemployment Among Ages 55 to 59 years Correlation Chart
The statistical analysis conducted on geographies consisting of 486,654,676 people shows a substantial positive correlation between the proportion of Blacks/African Americans and unemployment rate among population between the ages 55 and 59 in the United States with a correlation coefficient (R) of 0.558 and weighted average of 5.5%. Similarly, the statistical analysis conducted on geographies consisting of 128,562,298 people shows a moderate positive correlation between the proportion of Immigrants from Serbia and unemployment rate among population between the ages 55 and 59 in the United States with a correlation coefficient (R) of 0.412 and weighted average of 4.7%, a difference of 16.5%.
Unemployment Among Ages 55 to 59 years Correlation Summary
| Measurement | Black/African American | Immigrants from Serbia |
| Minimum | 1.7% | 0.90% |
| Maximum | 17.2% | 17.7% |
| Range | 15.5% | 16.8% |
| Mean | 6.0% | 5.4% |
| Median | 5.4% | 4.5% |
| Interquartile 25% (IQ1) | 4.6% | 3.8% |
| Interquartile 75% (IQ3) | 7.0% | 6.2% |
| Interquartile Range (IQR) | 2.4% | 2.4% |
| Standard Deviation (Sample) | 2.2% | 3.0% |
| Standard Deviation (Population) | 2.2% | 2.9% |
Similar Demographics by Unemployment Among Ages 55 to 59 years
Demographics Similar to Blacks/African Americans by Unemployment Among Ages 55 to 59 years
In terms of unemployment among ages 55 to 59 years, the demographic groups most similar to Blacks/African Americans are Immigrants from Portugal (5.5%, a difference of 0.17%), Immigrants from Cabo Verde (5.5%, a difference of 0.29%), Immigrants from Belize (5.5%, a difference of 0.51%), Marshallese (5.5%, a difference of 0.52%), and Sierra Leonean (5.5%, a difference of 0.53%).
| Demographics | Rating | Rank | Unemployment Among Ages 55 to 59 years |
| Immigrants | Mexico | 0.0 /100 | #297 | Tragic 5.3% |
| Hispanics or Latinos | 0.0 /100 | #298 | Tragic 5.4% |
| Cape Verdeans | 0.0 /100 | #299 | Tragic 5.4% |
| Immigrants | St. Vincent and the Grenadines | 0.0 /100 | #300 | Tragic 5.4% |
| Immigrants | Dominica | 0.0 /100 | #301 | Tragic 5.5% |
| Sierra Leoneans | 0.0 /100 | #302 | Tragic 5.5% |
| Marshallese | 0.0 /100 | #303 | Tragic 5.5% |
| Blacks/African Americans | 0.0 /100 | #304 | Tragic 5.5% |
| Immigrants | Portugal | 0.0 /100 | #305 | Tragic 5.5% |
| Immigrants | Cabo Verde | 0.0 /100 | #306 | Tragic 5.5% |
| Immigrants | Belize | 0.0 /100 | #307 | Tragic 5.5% |
| Spanish American Indians | 0.0 /100 | #308 | Tragic 5.6% |
| Nepalese | 0.0 /100 | #309 | Tragic 5.6% |
| Belizeans | 0.0 /100 | #310 | Tragic 5.6% |
| Houma | 0.0 /100 | #311 | Tragic 5.6% |
Demographics Similar to Immigrants from Serbia by Unemployment Among Ages 55 to 59 years
In terms of unemployment among ages 55 to 59 years, the demographic groups most similar to Immigrants from Serbia are Immigrants from Malaysia (4.7%, a difference of 0.010%), Icelander (4.7%, a difference of 0.010%), Pennsylvania German (4.7%, a difference of 0.060%), Immigrants from Sweden (4.7%, a difference of 0.090%), and Lithuanian (4.7%, a difference of 0.11%).
| Demographics | Rating | Rank | Unemployment Among Ages 55 to 59 years |
| Whites/Caucasians | 90.7 /100 | #119 | Exceptional 4.7% |
| Immigrants | South Africa | 89.9 /100 | #120 | Excellent 4.7% |
| Pakistanis | 89.7 /100 | #121 | Excellent 4.7% |
| Immigrants | Afghanistan | 89.5 /100 | #122 | Excellent 4.7% |
| Immigrants | Japan | 89.4 /100 | #123 | Excellent 4.7% |
| Lithuanians | 88.8 /100 | #124 | Excellent 4.7% |
| Immigrants | Malaysia | 87.9 /100 | #125 | Excellent 4.7% |
| Immigrants | Serbia | 87.8 /100 | #126 | Excellent 4.7% |
| Icelanders | 87.7 /100 | #127 | Excellent 4.7% |
| Pennsylvania Germans | 87.1 /100 | #128 | Excellent 4.7% |
| Immigrants | Sweden | 86.8 /100 | #129 | Excellent 4.7% |
| Greeks | 86.6 /100 | #130 | Excellent 4.7% |
| Immigrants | Thailand | 85.4 /100 | #131 | Excellent 4.7% |
| Immigrants | Romania | 85.3 /100 | #132 | Excellent 4.7% |
| Immigrants | Netherlands | 84.5 /100 | #133 | Excellent 4.7% |