Alaskan Athabascan vs Immigrants from Switzerland Currently Married
COMPARE
Alaskan Athabascan
Immigrants from Switzerland
Currently Married
Currently Married Comparison
Alaskan Athabascans
Immigrants from Switzerland
44.6%
CURRENTLY MARRIED
0.9/ 100
METRIC RATING
235th/ 347
METRIC RANK
46.9%
CURRENTLY MARRIED
67.8/ 100
METRIC RATING
157th/ 347
METRIC RANK
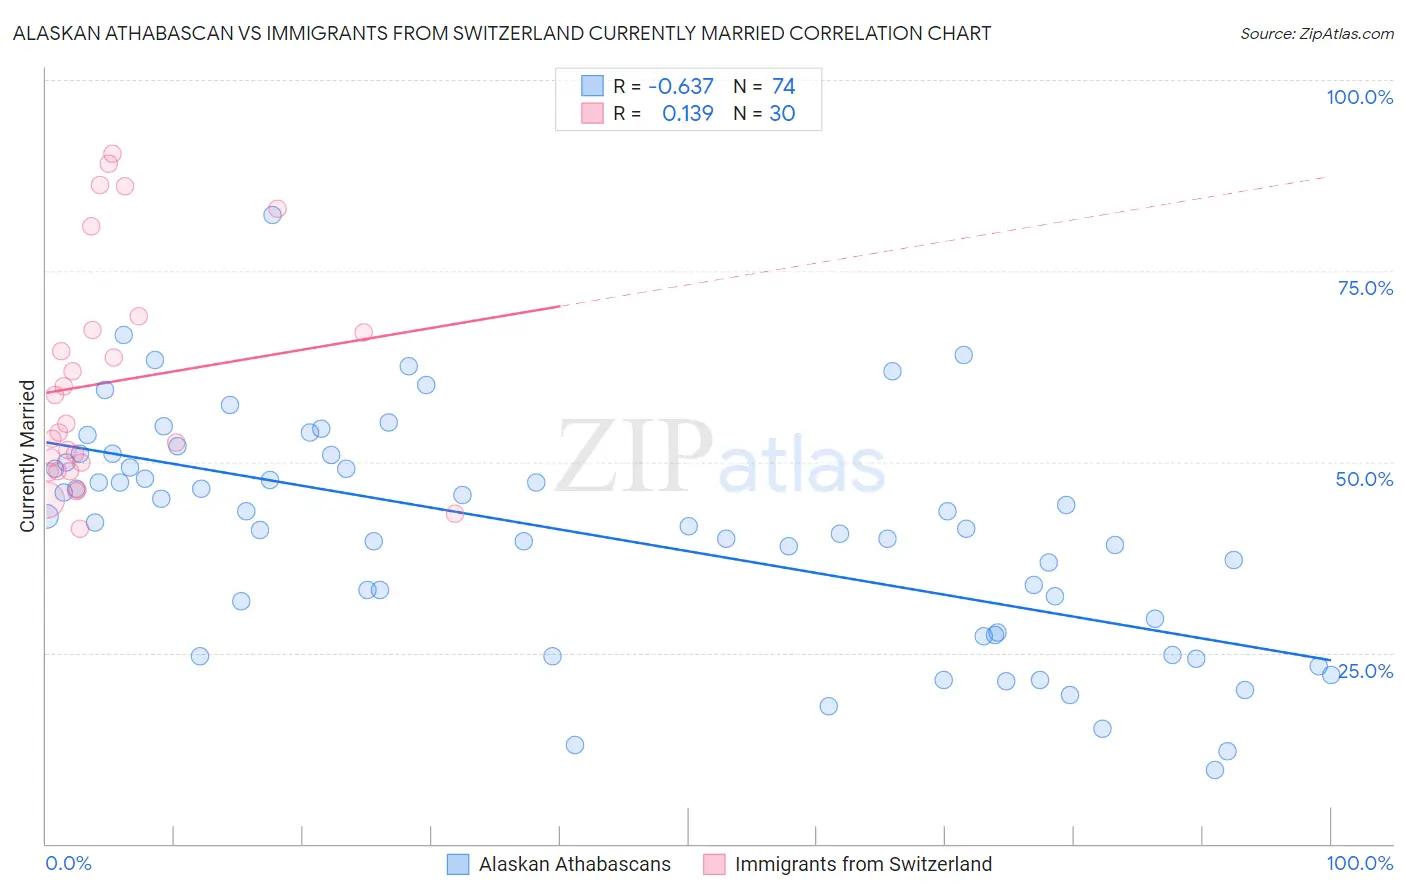
Alaskan Athabascan vs Immigrants from Switzerland Currently Married Correlation Chart
The statistical analysis conducted on geographies consisting of 45,820,219 people shows a significant negative correlation between the proportion of Alaskan Athabascans and percentage of population currently married in the United States with a correlation coefficient (R) of -0.637 and weighted average of 44.6%. Similarly, the statistical analysis conducted on geographies consisting of 148,074,779 people shows a poor positive correlation between the proportion of Immigrants from Switzerland and percentage of population currently married in the United States with a correlation coefficient (R) of 0.139 and weighted average of 46.9%, a difference of 5.1%.
Currently Married Correlation Summary
| Measurement | Alaskan Athabascan | Immigrants from Switzerland |
| Minimum | 9.6% | 41.3% |
| Maximum | 82.4% | 90.4% |
| Range | 72.8% | 49.1% |
| Mean | 40.6% | 60.5% |
| Median | 41.9% | 54.4% |
| Interquartile 25% (IQ1) | 27.7% | 48.8% |
| Interquartile 75% (IQ3) | 49.9% | 67.3% |
| Interquartile Range (IQR) | 22.2% | 18.5% |
| Standard Deviation (Sample) | 14.7% | 14.9% |
| Standard Deviation (Population) | 14.6% | 14.7% |
Similar Demographics by Currently Married
Demographics Similar to Alaskan Athabascans by Currently Married
In terms of currently married, the demographic groups most similar to Alaskan Athabascans are Cuban (44.6%, a difference of 0.010%), Seminole (44.6%, a difference of 0.010%), Moroccan (44.6%, a difference of 0.090%), Immigrants from Saudi Arabia (44.7%, a difference of 0.16%), and Iroquois (44.7%, a difference of 0.16%).
| Demographics | Rating | Rank | Currently Married |
| Immigrants | Uruguay | 2.0 /100 | #228 | Tragic 45.0% |
| Cree | 1.7 /100 | #229 | Tragic 44.9% |
| Immigrants | Kenya | 1.6 /100 | #230 | Tragic 44.9% |
| Immigrants | Panama | 1.5 /100 | #231 | Tragic 44.9% |
| Nepalese | 1.2 /100 | #232 | Tragic 44.7% |
| Immigrants | Saudi Arabia | 1.1 /100 | #233 | Tragic 44.7% |
| Iroquois | 1.1 /100 | #234 | Tragic 44.7% |
| Alaskan Athabascans | 0.9 /100 | #235 | Tragic 44.6% |
| Cubans | 0.9 /100 | #236 | Tragic 44.6% |
| Seminole | 0.9 /100 | #237 | Tragic 44.6% |
| Moroccans | 0.9 /100 | #238 | Tragic 44.6% |
| Immigrants | Mexico | 0.7 /100 | #239 | Tragic 44.5% |
| Mexican American Indians | 0.7 /100 | #240 | Tragic 44.5% |
| Ethiopians | 0.7 /100 | #241 | Tragic 44.5% |
| Immigrants | Cambodia | 0.7 /100 | #242 | Tragic 44.5% |
Demographics Similar to Immigrants from Switzerland by Currently Married
In terms of currently married, the demographic groups most similar to Immigrants from Switzerland are Spanish (47.0%, a difference of 0.010%), Immigrants from Venezuela (47.0%, a difference of 0.030%), Albanian (47.0%, a difference of 0.030%), Arab (47.0%, a difference of 0.030%), and Immigrants from Serbia (47.0%, a difference of 0.040%).
| Demographics | Rating | Rank | Currently Married |
| Immigrants | Turkey | 70.0 /100 | #150 | Good 47.0% |
| Chileans | 69.8 /100 | #151 | Good 47.0% |
| Immigrants | Serbia | 68.8 /100 | #152 | Good 47.0% |
| Immigrants | Venezuela | 68.6 /100 | #153 | Good 47.0% |
| Albanians | 68.6 /100 | #154 | Good 47.0% |
| Arabs | 68.6 /100 | #155 | Good 47.0% |
| Spanish | 68.1 /100 | #156 | Good 47.0% |
| Immigrants | Switzerland | 67.8 /100 | #157 | Good 46.9% |
| Cherokee | 66.8 /100 | #158 | Good 46.9% |
| Iraqis | 66.4 /100 | #159 | Good 46.9% |
| Immigrants | Uzbekistan | 66.0 /100 | #160 | Good 46.9% |
| Immigrants | Southern Europe | 65.9 /100 | #161 | Good 46.9% |
| Immigrants | Nonimmigrants | 65.4 /100 | #162 | Good 46.9% |
| Delaware | 64.7 /100 | #163 | Good 46.9% |
| Immigrants | Western Asia | 64.2 /100 | #164 | Good 46.9% |