Alaskan Athabascan vs Immigrants from Moldova Currently Married
COMPARE
Alaskan Athabascan
Immigrants from Moldova
Currently Married
Currently Married Comparison
Alaskan Athabascans
Immigrants from Moldova
44.6%
CURRENTLY MARRIED
0.9/ 100
METRIC RATING
235th/ 347
METRIC RANK
48.5%
CURRENTLY MARRIED
98.7/ 100
METRIC RATING
54th/ 347
METRIC RANK
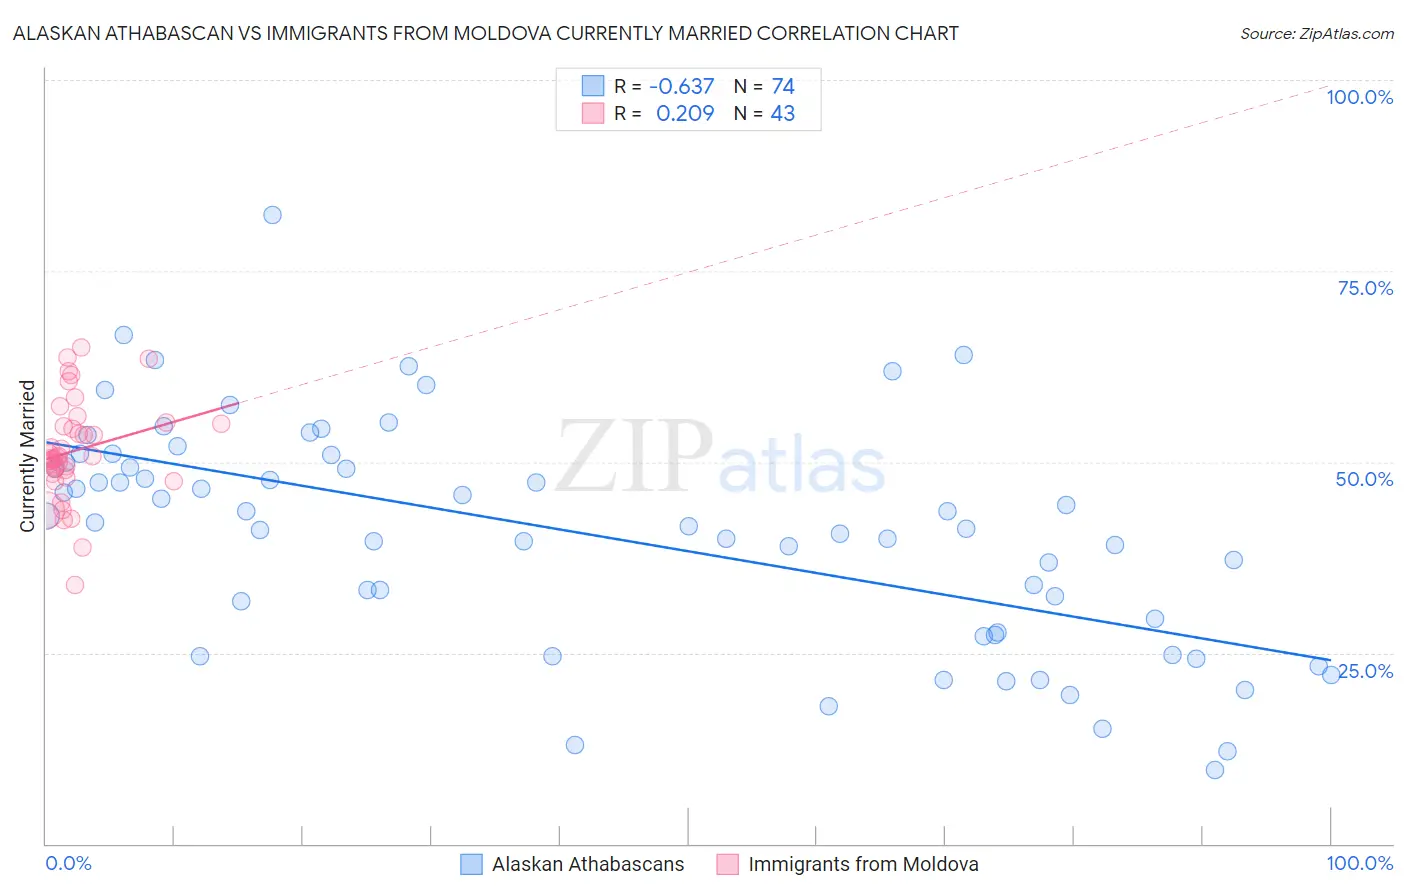
Alaskan Athabascan vs Immigrants from Moldova Currently Married Correlation Chart
The statistical analysis conducted on geographies consisting of 45,820,219 people shows a significant negative correlation between the proportion of Alaskan Athabascans and percentage of population currently married in the United States with a correlation coefficient (R) of -0.637 and weighted average of 44.6%. Similarly, the statistical analysis conducted on geographies consisting of 124,399,411 people shows a weak positive correlation between the proportion of Immigrants from Moldova and percentage of population currently married in the United States with a correlation coefficient (R) of 0.209 and weighted average of 48.5%, a difference of 8.6%.
Currently Married Correlation Summary
| Measurement | Alaskan Athabascan | Immigrants from Moldova |
| Minimum | 9.6% | 33.9% |
| Maximum | 82.4% | 65.0% |
| Range | 72.8% | 31.1% |
| Mean | 40.6% | 51.5% |
| Median | 41.9% | 50.6% |
| Interquartile 25% (IQ1) | 27.7% | 48.4% |
| Interquartile 75% (IQ3) | 49.9% | 55.0% |
| Interquartile Range (IQR) | 22.2% | 6.6% |
| Standard Deviation (Sample) | 14.7% | 6.6% |
| Standard Deviation (Population) | 14.6% | 6.5% |
Similar Demographics by Currently Married
Demographics Similar to Alaskan Athabascans by Currently Married
In terms of currently married, the demographic groups most similar to Alaskan Athabascans are Cuban (44.6%, a difference of 0.010%), Seminole (44.6%, a difference of 0.010%), Moroccan (44.6%, a difference of 0.090%), Immigrants from Saudi Arabia (44.7%, a difference of 0.16%), and Iroquois (44.7%, a difference of 0.16%).
| Demographics | Rating | Rank | Currently Married |
| Immigrants | Uruguay | 2.0 /100 | #228 | Tragic 45.0% |
| Cree | 1.7 /100 | #229 | Tragic 44.9% |
| Immigrants | Kenya | 1.6 /100 | #230 | Tragic 44.9% |
| Immigrants | Panama | 1.5 /100 | #231 | Tragic 44.9% |
| Nepalese | 1.2 /100 | #232 | Tragic 44.7% |
| Immigrants | Saudi Arabia | 1.1 /100 | #233 | Tragic 44.7% |
| Iroquois | 1.1 /100 | #234 | Tragic 44.7% |
| Alaskan Athabascans | 0.9 /100 | #235 | Tragic 44.6% |
| Cubans | 0.9 /100 | #236 | Tragic 44.6% |
| Seminole | 0.9 /100 | #237 | Tragic 44.6% |
| Moroccans | 0.9 /100 | #238 | Tragic 44.6% |
| Immigrants | Mexico | 0.7 /100 | #239 | Tragic 44.5% |
| Mexican American Indians | 0.7 /100 | #240 | Tragic 44.5% |
| Ethiopians | 0.7 /100 | #241 | Tragic 44.5% |
| Immigrants | Cambodia | 0.7 /100 | #242 | Tragic 44.5% |
Demographics Similar to Immigrants from Moldova by Currently Married
In terms of currently married, the demographic groups most similar to Immigrants from Moldova are Immigrants from North Macedonia (48.5%, a difference of 0.0%), Latvian (48.5%, a difference of 0.0%), Immigrants from Netherlands (48.5%, a difference of 0.030%), Immigrants from Austria (48.5%, a difference of 0.060%), and French (48.4%, a difference of 0.080%).
| Demographics | Rating | Rank | Currently Married |
| Northern Europeans | 99.2 /100 | #47 | Exceptional 48.7% |
| Austrians | 99.2 /100 | #48 | Exceptional 48.7% |
| Bhutanese | 99.1 /100 | #49 | Exceptional 48.6% |
| Iranians | 99.0 /100 | #50 | Exceptional 48.6% |
| Whites/Caucasians | 99.0 /100 | #51 | Exceptional 48.6% |
| Russians | 98.9 /100 | #52 | Exceptional 48.6% |
| Immigrants | Austria | 98.8 /100 | #53 | Exceptional 48.5% |
| Immigrants | Moldova | 98.7 /100 | #54 | Exceptional 48.5% |
| Immigrants | North Macedonia | 98.7 /100 | #55 | Exceptional 48.5% |
| Latvians | 98.7 /100 | #56 | Exceptional 48.5% |
| Immigrants | Netherlands | 98.6 /100 | #57 | Exceptional 48.5% |
| French | 98.6 /100 | #58 | Exceptional 48.4% |
| Immigrants | Ireland | 98.5 /100 | #59 | Exceptional 48.4% |
| Immigrants | Romania | 98.5 /100 | #60 | Exceptional 48.4% |
| Romanians | 98.5 /100 | #61 | Exceptional 48.4% |