Ugandan vs Immigrants from Switzerland Currently Married
COMPARE
Ugandan
Immigrants from Switzerland
Currently Married
Currently Married Comparison
Ugandans
Immigrants from Switzerland
44.2%
CURRENTLY MARRIED
0.4/ 100
METRIC RATING
247th/ 347
METRIC RANK
46.9%
CURRENTLY MARRIED
67.8/ 100
METRIC RATING
157th/ 347
METRIC RANK
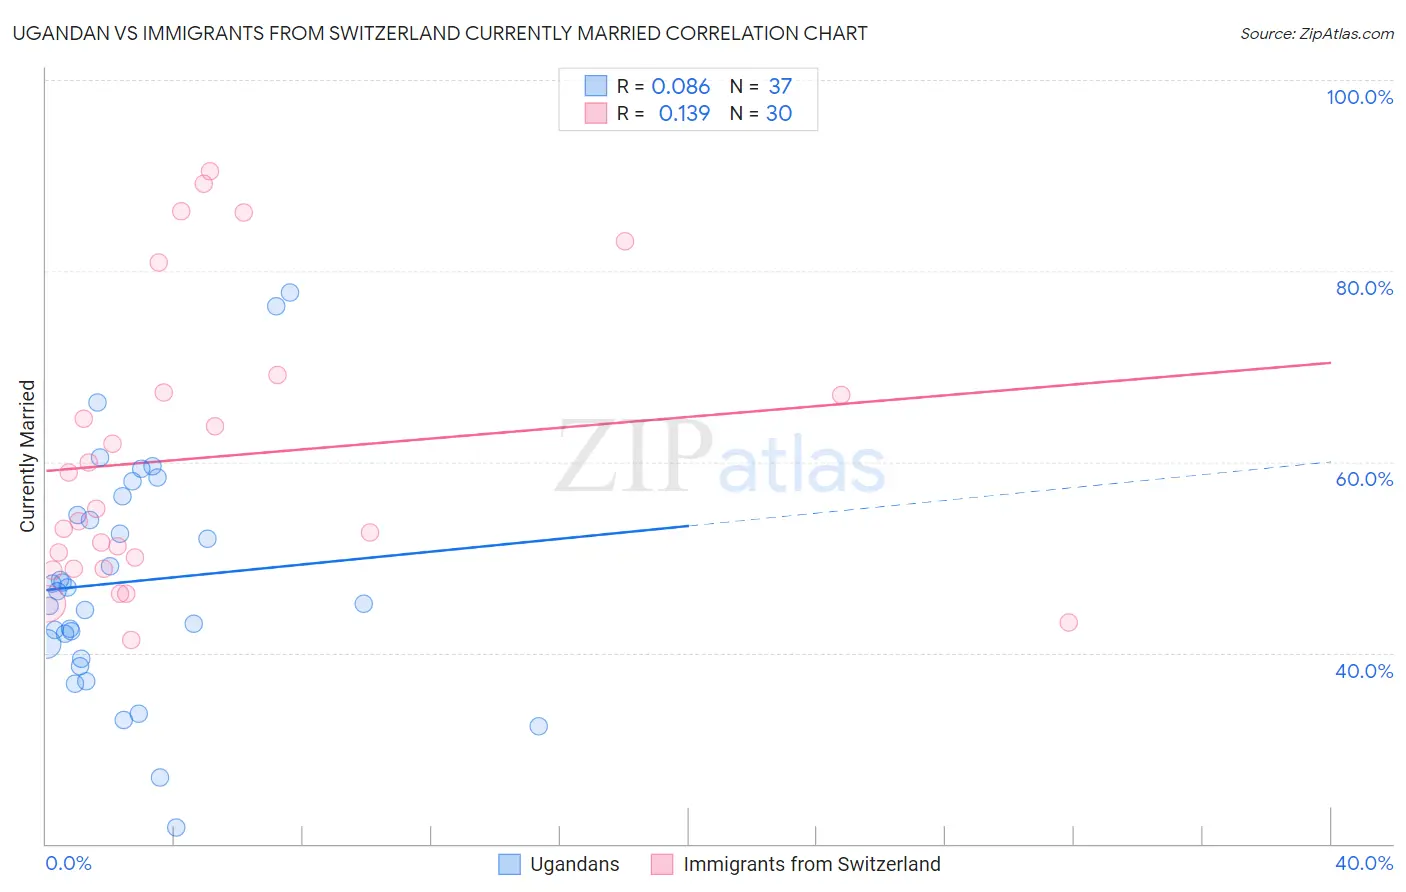
Ugandan vs Immigrants from Switzerland Currently Married Correlation Chart
The statistical analysis conducted on geographies consisting of 94,016,399 people shows a slight positive correlation between the proportion of Ugandans and percentage of population currently married in the United States with a correlation coefficient (R) of 0.086 and weighted average of 44.2%. Similarly, the statistical analysis conducted on geographies consisting of 148,074,779 people shows a poor positive correlation between the proportion of Immigrants from Switzerland and percentage of population currently married in the United States with a correlation coefficient (R) of 0.139 and weighted average of 46.9%, a difference of 6.1%.
Currently Married Correlation Summary
| Measurement | Ugandan | Immigrants from Switzerland |
| Minimum | 21.7% | 41.3% |
| Maximum | 77.7% | 90.4% |
| Range | 56.0% | 49.1% |
| Mean | 47.5% | 60.5% |
| Median | 46.4% | 54.4% |
| Interquartile 25% (IQ1) | 40.1% | 48.8% |
| Interquartile 75% (IQ3) | 55.4% | 67.3% |
| Interquartile Range (IQR) | 15.3% | 18.5% |
| Standard Deviation (Sample) | 12.1% | 14.9% |
| Standard Deviation (Population) | 11.9% | 14.7% |
Similar Demographics by Currently Married
Demographics Similar to Ugandans by Currently Married
In terms of currently married, the demographic groups most similar to Ugandans are Nicaraguan (44.2%, a difference of 0.090%), Immigrants from Cameroon (44.2%, a difference of 0.10%), Immigrants from Eastern Africa (44.2%, a difference of 0.12%), Immigrants from Burma/Myanmar (44.3%, a difference of 0.13%), and Blackfeet (44.2%, a difference of 0.19%).
| Demographics | Rating | Rank | Currently Married |
| Mexican American Indians | 0.7 /100 | #240 | Tragic 44.5% |
| Ethiopians | 0.7 /100 | #241 | Tragic 44.5% |
| Immigrants | Cambodia | 0.7 /100 | #242 | Tragic 44.5% |
| Immigrants | Ethiopia | 0.7 /100 | #243 | Tragic 44.5% |
| Japanese | 0.6 /100 | #244 | Tragic 44.5% |
| Immigrants | Armenia | 0.4 /100 | #245 | Tragic 44.3% |
| Immigrants | Burma/Myanmar | 0.4 /100 | #246 | Tragic 44.3% |
| Ugandans | 0.4 /100 | #247 | Tragic 44.2% |
| Nicaraguans | 0.3 /100 | #248 | Tragic 44.2% |
| Immigrants | Cameroon | 0.3 /100 | #249 | Tragic 44.2% |
| Immigrants | Eastern Africa | 0.3 /100 | #250 | Tragic 44.2% |
| Blackfeet | 0.3 /100 | #251 | Tragic 44.2% |
| Hispanics or Latinos | 0.3 /100 | #252 | Tragic 44.1% |
| Immigrants | Central America | 0.3 /100 | #253 | Tragic 44.1% |
| Vietnamese | 0.2 /100 | #254 | Tragic 44.0% |
Demographics Similar to Immigrants from Switzerland by Currently Married
In terms of currently married, the demographic groups most similar to Immigrants from Switzerland are Spanish (47.0%, a difference of 0.010%), Immigrants from Venezuela (47.0%, a difference of 0.030%), Albanian (47.0%, a difference of 0.030%), Arab (47.0%, a difference of 0.030%), and Immigrants from Serbia (47.0%, a difference of 0.040%).
| Demographics | Rating | Rank | Currently Married |
| Immigrants | Turkey | 70.0 /100 | #150 | Good 47.0% |
| Chileans | 69.8 /100 | #151 | Good 47.0% |
| Immigrants | Serbia | 68.8 /100 | #152 | Good 47.0% |
| Immigrants | Venezuela | 68.6 /100 | #153 | Good 47.0% |
| Albanians | 68.6 /100 | #154 | Good 47.0% |
| Arabs | 68.6 /100 | #155 | Good 47.0% |
| Spanish | 68.1 /100 | #156 | Good 47.0% |
| Immigrants | Switzerland | 67.8 /100 | #157 | Good 46.9% |
| Cherokee | 66.8 /100 | #158 | Good 46.9% |
| Iraqis | 66.4 /100 | #159 | Good 46.9% |
| Immigrants | Uzbekistan | 66.0 /100 | #160 | Good 46.9% |
| Immigrants | Southern Europe | 65.9 /100 | #161 | Good 46.9% |
| Immigrants | Nonimmigrants | 65.4 /100 | #162 | Good 46.9% |
| Delaware | 64.7 /100 | #163 | Good 46.9% |
| Immigrants | Western Asia | 64.2 /100 | #164 | Good 46.9% |