Yugoslavian vs Immigrants from Nepal No Schooling Completed
COMPARE
Yugoslavian
Immigrants from Nepal
No Schooling Completed
No Schooling Completed Comparison
Yugoslavians
Immigrants from Nepal
1.8%
NO SCHOOLING COMPLETED
97.2/ 100
METRIC RATING
107th/ 347
METRIC RANK
2.3%
NO SCHOOLING COMPLETED
6.4/ 100
METRIC RATING
218th/ 347
METRIC RANK
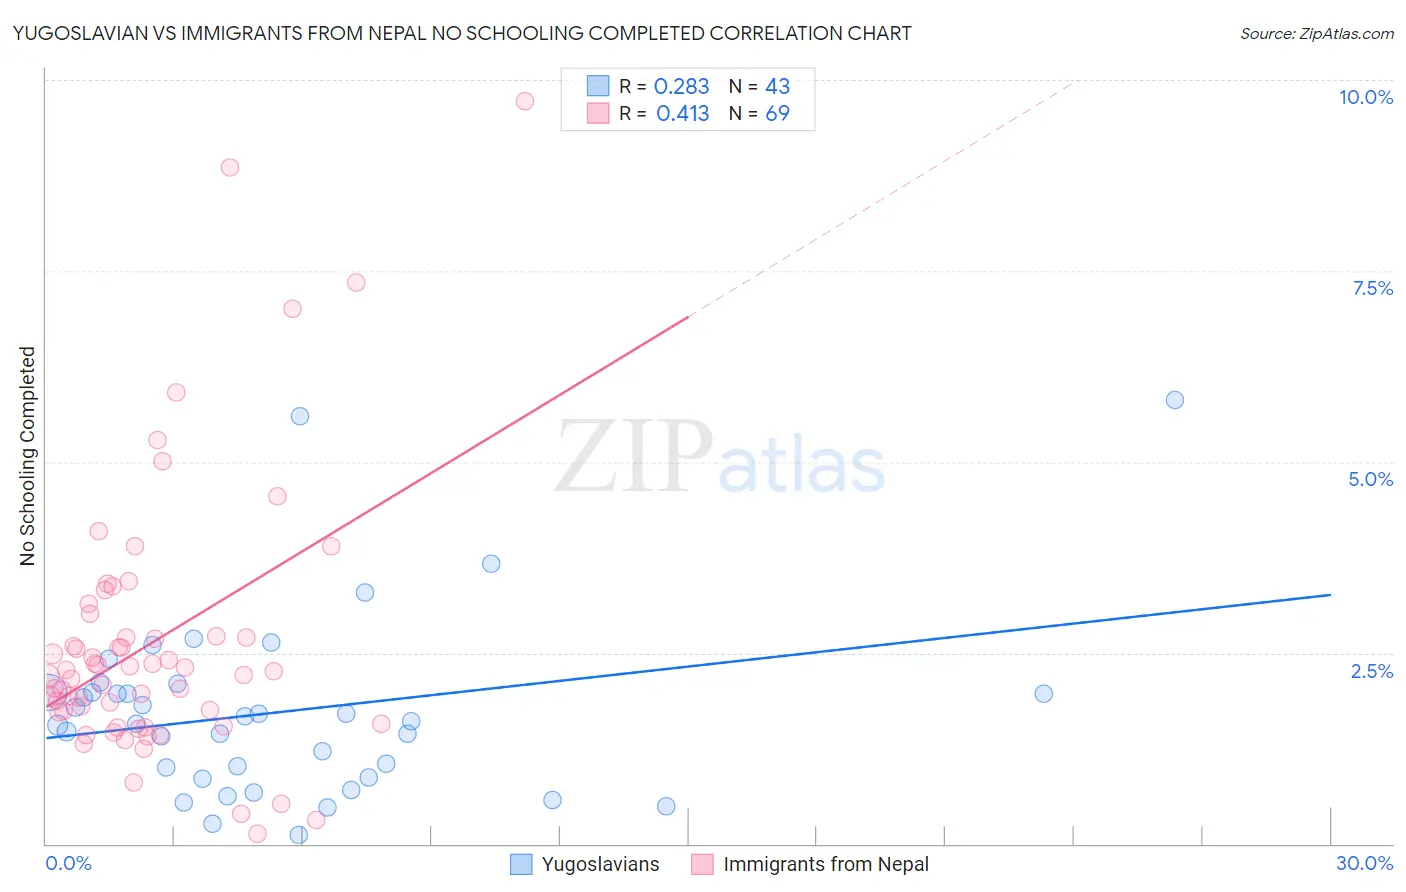
Yugoslavian vs Immigrants from Nepal No Schooling Completed Correlation Chart
The statistical analysis conducted on geographies consisting of 283,637,771 people shows a weak positive correlation between the proportion of Yugoslavians and percentage of population with no schooling in the United States with a correlation coefficient (R) of 0.283 and weighted average of 1.8%. Similarly, the statistical analysis conducted on geographies consisting of 186,155,047 people shows a moderate positive correlation between the proportion of Immigrants from Nepal and percentage of population with no schooling in the United States with a correlation coefficient (R) of 0.413 and weighted average of 2.3%, a difference of 23.8%.
No Schooling Completed Correlation Summary
| Measurement | Yugoslavian | Immigrants from Nepal |
| Minimum | 0.12% | 0.12% |
| Maximum | 5.8% | 9.7% |
| Range | 5.7% | 9.6% |
| Mean | 1.7% | 2.6% |
| Median | 1.6% | 2.3% |
| Interquartile 25% (IQ1) | 0.86% | 1.6% |
| Interquartile 75% (IQ3) | 2.0% | 2.9% |
| Interquartile Range (IQR) | 1.1% | 1.2% |
| Standard Deviation (Sample) | 1.2% | 1.8% |
| Standard Deviation (Population) | 1.2% | 1.8% |
Similar Demographics by No Schooling Completed
Demographics Similar to Yugoslavians by No Schooling Completed
In terms of no schooling completed, the demographic groups most similar to Yugoslavians are Immigrants from France (1.8%, a difference of 0.040%), Okinawan (1.8%, a difference of 0.22%), German Russian (1.8%, a difference of 0.44%), Thai (1.8%, a difference of 0.46%), and Immigrants from Saudi Arabia (1.9%, a difference of 0.57%).
| Demographics | Rating | Rank | No Schooling Completed |
| Immigrants | Singapore | 98.0 /100 | #100 | Exceptional 1.8% |
| Immigrants | Czechoslovakia | 97.9 /100 | #101 | Exceptional 1.8% |
| Immigrants | Switzerland | 97.9 /100 | #102 | Exceptional 1.8% |
| Basques | 97.9 /100 | #103 | Exceptional 1.8% |
| Thais | 97.5 /100 | #104 | Exceptional 1.8% |
| German Russians | 97.5 /100 | #105 | Exceptional 1.8% |
| Immigrants | France | 97.3 /100 | #106 | Exceptional 1.8% |
| Yugoslavians | 97.2 /100 | #107 | Exceptional 1.8% |
| Okinawans | 97.1 /100 | #108 | Exceptional 1.8% |
| Immigrants | Saudi Arabia | 96.8 /100 | #109 | Exceptional 1.9% |
| Immigrants | Latvia | 96.7 /100 | #110 | Exceptional 1.9% |
| Immigrants | Japan | 96.6 /100 | #111 | Exceptional 1.9% |
| Pueblo | 96.4 /100 | #112 | Exceptional 1.9% |
| Immigrants | Zimbabwe | 96.2 /100 | #113 | Exceptional 1.9% |
| Immigrants | Norway | 96.1 /100 | #114 | Exceptional 1.9% |
Demographics Similar to Immigrants from Nepal by No Schooling Completed
In terms of no schooling completed, the demographic groups most similar to Immigrants from Nepal are Immigrants from Syria (2.3%, a difference of 0.11%), Tongan (2.3%, a difference of 0.19%), Immigrants from Zaire (2.3%, a difference of 0.39%), Senegalese (2.3%, a difference of 0.44%), and Immigrants from Costa Rica (2.3%, a difference of 0.70%).
| Demographics | Rating | Rank | No Schooling Completed |
| Immigrants | Panama | 8.8 /100 | #211 | Tragic 2.3% |
| Immigrants | Morocco | 8.7 /100 | #212 | Tragic 2.3% |
| Ute | 8.2 /100 | #213 | Tragic 2.3% |
| Samoans | 8.2 /100 | #214 | Tragic 2.3% |
| Immigrants | Zaire | 7.2 /100 | #215 | Tragic 2.3% |
| Tongans | 6.8 /100 | #216 | Tragic 2.3% |
| Immigrants | Syria | 6.6 /100 | #217 | Tragic 2.3% |
| Immigrants | Nepal | 6.4 /100 | #218 | Tragic 2.3% |
| Senegalese | 5.6 /100 | #219 | Tragic 2.3% |
| Immigrants | Costa Rica | 5.1 /100 | #220 | Tragic 2.3% |
| Immigrants | Sudan | 5.0 /100 | #221 | Tragic 2.3% |
| Sub-Saharan Africans | 4.7 /100 | #222 | Tragic 2.3% |
| Immigrants | Lebanon | 4.5 /100 | #223 | Tragic 2.3% |
| Tohono O'odham | 4.1 /100 | #224 | Tragic 2.3% |
| Sudanese | 4.1 /100 | #225 | Tragic 2.3% |