Ute vs South American Indian Professional Degree
COMPARE
Ute
South American Indian
Professional Degree
Professional Degree Comparison
Ute
South American Indians
4.0%
PROFESSIONAL DEGREE
8.2/ 100
METRIC RATING
220th/ 347
METRIC RANK
4.8%
PROFESSIONAL DEGREE
89.9/ 100
METRIC RATING
134th/ 347
METRIC RANK
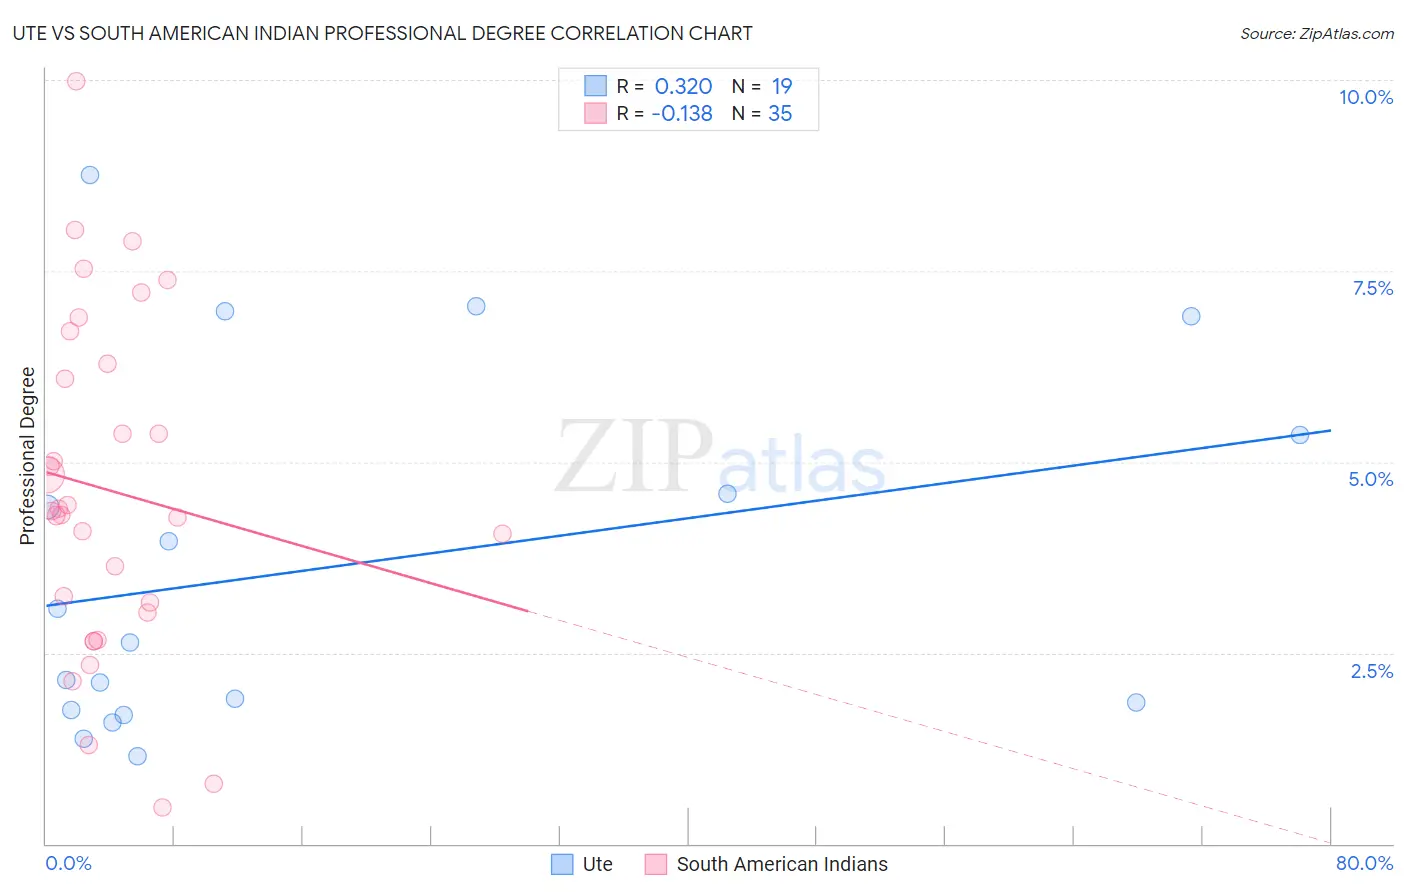
Ute vs South American Indian Professional Degree Correlation Chart
The statistical analysis conducted on geographies consisting of 55,594,761 people shows a mild positive correlation between the proportion of Ute and percentage of population with at least professional degree education in the United States with a correlation coefficient (R) of 0.320 and weighted average of 4.0%. Similarly, the statistical analysis conducted on geographies consisting of 164,487,198 people shows a poor negative correlation between the proportion of South American Indians and percentage of population with at least professional degree education in the United States with a correlation coefficient (R) of -0.138 and weighted average of 4.8%, a difference of 18.3%.
Professional Degree Correlation Summary
| Measurement | Ute | South American Indian |
| Minimum | 1.1% | 0.48% |
| Maximum | 8.7% | 10.0% |
| Range | 7.6% | 9.5% |
| Mean | 3.6% | 4.6% |
| Median | 2.6% | 4.4% |
| Interquartile 25% (IQ1) | 1.8% | 3.0% |
| Interquartile 75% (IQ3) | 5.3% | 6.3% |
| Interquartile Range (IQR) | 3.6% | 3.3% |
| Standard Deviation (Sample) | 2.3% | 2.2% |
| Standard Deviation (Population) | 2.3% | 2.2% |
Similar Demographics by Professional Degree
Demographics Similar to Ute by Professional Degree
In terms of professional degree, the demographic groups most similar to Ute are French Canadian (4.0%, a difference of 0.13%), Immigrants from South Eastern Asia (4.0%, a difference of 0.35%), Immigrants from Western Africa (4.0%, a difference of 0.38%), Dutch (4.0%, a difference of 0.39%), and Immigrants from Bosnia and Herzegovina (4.0%, a difference of 0.46%).
| Demographics | Rating | Rank | Professional Degree |
| Koreans | 10.7 /100 | #213 | Poor 4.1% |
| Immigrants | Ghana | 10.6 /100 | #214 | Poor 4.1% |
| Portuguese | 10.5 /100 | #215 | Poor 4.1% |
| West Indians | 9.8 /100 | #216 | Tragic 4.1% |
| Immigrants | Vietnam | 9.4 /100 | #217 | Tragic 4.0% |
| Dutch | 9.0 /100 | #218 | Tragic 4.0% |
| Immigrants | South Eastern Asia | 8.9 /100 | #219 | Tragic 4.0% |
| Ute | 8.2 /100 | #220 | Tragic 4.0% |
| French Canadians | 8.0 /100 | #221 | Tragic 4.0% |
| Immigrants | Western Africa | 7.5 /100 | #222 | Tragic 4.0% |
| Immigrants | Bosnia and Herzegovina | 7.4 /100 | #223 | Tragic 4.0% |
| Trinidadians and Tobagonians | 7.1 /100 | #224 | Tragic 4.0% |
| Tlingit-Haida | 6.9 /100 | #225 | Tragic 4.0% |
| German Russians | 6.1 /100 | #226 | Tragic 4.0% |
| Cubans | 5.9 /100 | #227 | Tragic 4.0% |
Demographics Similar to South American Indians by Professional Degree
In terms of professional degree, the demographic groups most similar to South American Indians are Macedonian (4.8%, a difference of 0.040%), Italian (4.8%, a difference of 0.12%), Immigrants from Jordan (4.7%, a difference of 0.31%), Jordanian (4.7%, a difference of 0.34%), and Pakistani (4.8%, a difference of 0.38%).
| Demographics | Rating | Rank | Professional Degree |
| Serbians | 92.6 /100 | #127 | Exceptional 4.8% |
| Immigrants | Eastern Africa | 92.5 /100 | #128 | Exceptional 4.8% |
| Palestinians | 91.5 /100 | #129 | Exceptional 4.8% |
| Icelanders | 91.5 /100 | #130 | Exceptional 4.8% |
| Immigrants | Nepal | 91.4 /100 | #131 | Exceptional 4.8% |
| Pakistanis | 90.9 /100 | #132 | Exceptional 4.8% |
| Italians | 90.2 /100 | #133 | Exceptional 4.8% |
| South American Indians | 89.9 /100 | #134 | Excellent 4.8% |
| Macedonians | 89.8 /100 | #135 | Excellent 4.8% |
| Immigrants | Jordan | 89.0 /100 | #136 | Excellent 4.7% |
| Jordanians | 88.9 /100 | #137 | Excellent 4.7% |
| Afghans | 88.8 /100 | #138 | Excellent 4.7% |
| South Americans | 85.6 /100 | #139 | Excellent 4.7% |
| Canadians | 84.4 /100 | #140 | Excellent 4.7% |
| Basques | 81.8 /100 | #141 | Excellent 4.6% |