Ute vs Immigrants from England Professional Degree
COMPARE
Ute
Immigrants from England
Professional Degree
Professional Degree Comparison
Ute
Immigrants from England
4.0%
PROFESSIONAL DEGREE
8.2/ 100
METRIC RATING
220th/ 347
METRIC RANK
5.3%
PROFESSIONAL DEGREE
99.6/ 100
METRIC RATING
80th/ 347
METRIC RANK
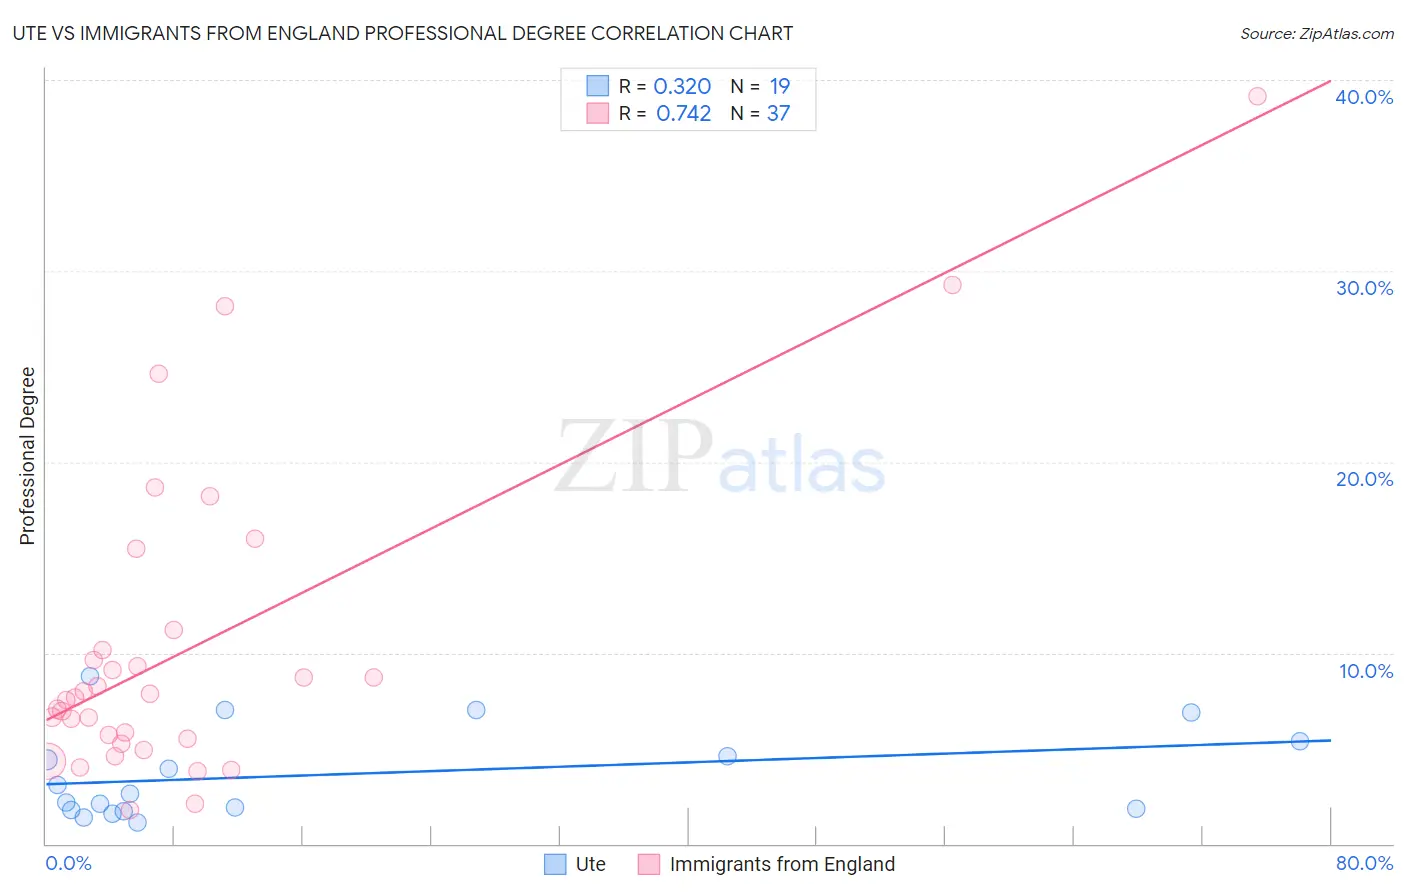
Ute vs Immigrants from England Professional Degree Correlation Chart
The statistical analysis conducted on geographies consisting of 55,594,761 people shows a mild positive correlation between the proportion of Ute and percentage of population with at least professional degree education in the United States with a correlation coefficient (R) of 0.320 and weighted average of 4.0%. Similarly, the statistical analysis conducted on geographies consisting of 391,206,555 people shows a strong positive correlation between the proportion of Immigrants from England and percentage of population with at least professional degree education in the United States with a correlation coefficient (R) of 0.742 and weighted average of 5.3%, a difference of 32.1%.
Professional Degree Correlation Summary
| Measurement | Ute | Immigrants from England |
| Minimum | 1.1% | 1.8% |
| Maximum | 8.7% | 39.2% |
| Range | 7.6% | 37.4% |
| Mean | 3.6% | 10.3% |
| Median | 2.6% | 7.7% |
| Interquartile 25% (IQ1) | 1.8% | 5.4% |
| Interquartile 75% (IQ3) | 5.3% | 10.7% |
| Interquartile Range (IQR) | 3.6% | 5.3% |
| Standard Deviation (Sample) | 2.3% | 8.3% |
| Standard Deviation (Population) | 2.3% | 8.2% |
Similar Demographics by Professional Degree
Demographics Similar to Ute by Professional Degree
In terms of professional degree, the demographic groups most similar to Ute are French Canadian (4.0%, a difference of 0.13%), Immigrants from South Eastern Asia (4.0%, a difference of 0.35%), Immigrants from Western Africa (4.0%, a difference of 0.38%), Dutch (4.0%, a difference of 0.39%), and Immigrants from Bosnia and Herzegovina (4.0%, a difference of 0.46%).
| Demographics | Rating | Rank | Professional Degree |
| Koreans | 10.7 /100 | #213 | Poor 4.1% |
| Immigrants | Ghana | 10.6 /100 | #214 | Poor 4.1% |
| Portuguese | 10.5 /100 | #215 | Poor 4.1% |
| West Indians | 9.8 /100 | #216 | Tragic 4.1% |
| Immigrants | Vietnam | 9.4 /100 | #217 | Tragic 4.0% |
| Dutch | 9.0 /100 | #218 | Tragic 4.0% |
| Immigrants | South Eastern Asia | 8.9 /100 | #219 | Tragic 4.0% |
| Ute | 8.2 /100 | #220 | Tragic 4.0% |
| French Canadians | 8.0 /100 | #221 | Tragic 4.0% |
| Immigrants | Western Africa | 7.5 /100 | #222 | Tragic 4.0% |
| Immigrants | Bosnia and Herzegovina | 7.4 /100 | #223 | Tragic 4.0% |
| Trinidadians and Tobagonians | 7.1 /100 | #224 | Tragic 4.0% |
| Tlingit-Haida | 6.9 /100 | #225 | Tragic 4.0% |
| German Russians | 6.1 /100 | #226 | Tragic 4.0% |
| Cubans | 5.9 /100 | #227 | Tragic 4.0% |
Demographics Similar to Immigrants from England by Professional Degree
In terms of professional degree, the demographic groups most similar to Immigrants from England are Immigrants from Brazil (5.3%, a difference of 0.010%), Immigrants from North America (5.3%, a difference of 0.39%), Romanian (5.3%, a difference of 0.51%), Armenian (5.3%, a difference of 0.56%), and Immigrants from Ethiopia (5.3%, a difference of 0.60%).
| Demographics | Rating | Rank | Professional Degree |
| Immigrants | Romania | 99.8 /100 | #73 | Exceptional 5.4% |
| Ethiopians | 99.7 /100 | #74 | Exceptional 5.4% |
| Immigrants | Indonesia | 99.7 /100 | #75 | Exceptional 5.3% |
| Immigrants | Canada | 99.7 /100 | #76 | Exceptional 5.3% |
| Immigrants | Ethiopia | 99.7 /100 | #77 | Exceptional 5.3% |
| Armenians | 99.7 /100 | #78 | Exceptional 5.3% |
| Immigrants | North America | 99.7 /100 | #79 | Exceptional 5.3% |
| Immigrants | England | 99.6 /100 | #80 | Exceptional 5.3% |
| Immigrants | Brazil | 99.6 /100 | #81 | Exceptional 5.3% |
| Romanians | 99.6 /100 | #82 | Exceptional 5.3% |
| Carpatho Rusyns | 99.6 /100 | #83 | Exceptional 5.3% |
| Immigrants | Croatia | 99.6 /100 | #84 | Exceptional 5.3% |
| Immigrants | Zimbabwe | 99.6 /100 | #85 | Exceptional 5.3% |
| Greeks | 99.6 /100 | #86 | Exceptional 5.3% |
| Immigrants | Chile | 99.5 /100 | #87 | Exceptional 5.3% |