Bolivian vs South American Indian Professional Degree
COMPARE
Bolivian
South American Indian
Professional Degree
Professional Degree Comparison
Bolivians
South American Indians
5.6%
PROFESSIONAL DEGREE
99.9/ 100
METRIC RATING
60th/ 347
METRIC RANK
4.8%
PROFESSIONAL DEGREE
89.9/ 100
METRIC RATING
134th/ 347
METRIC RANK
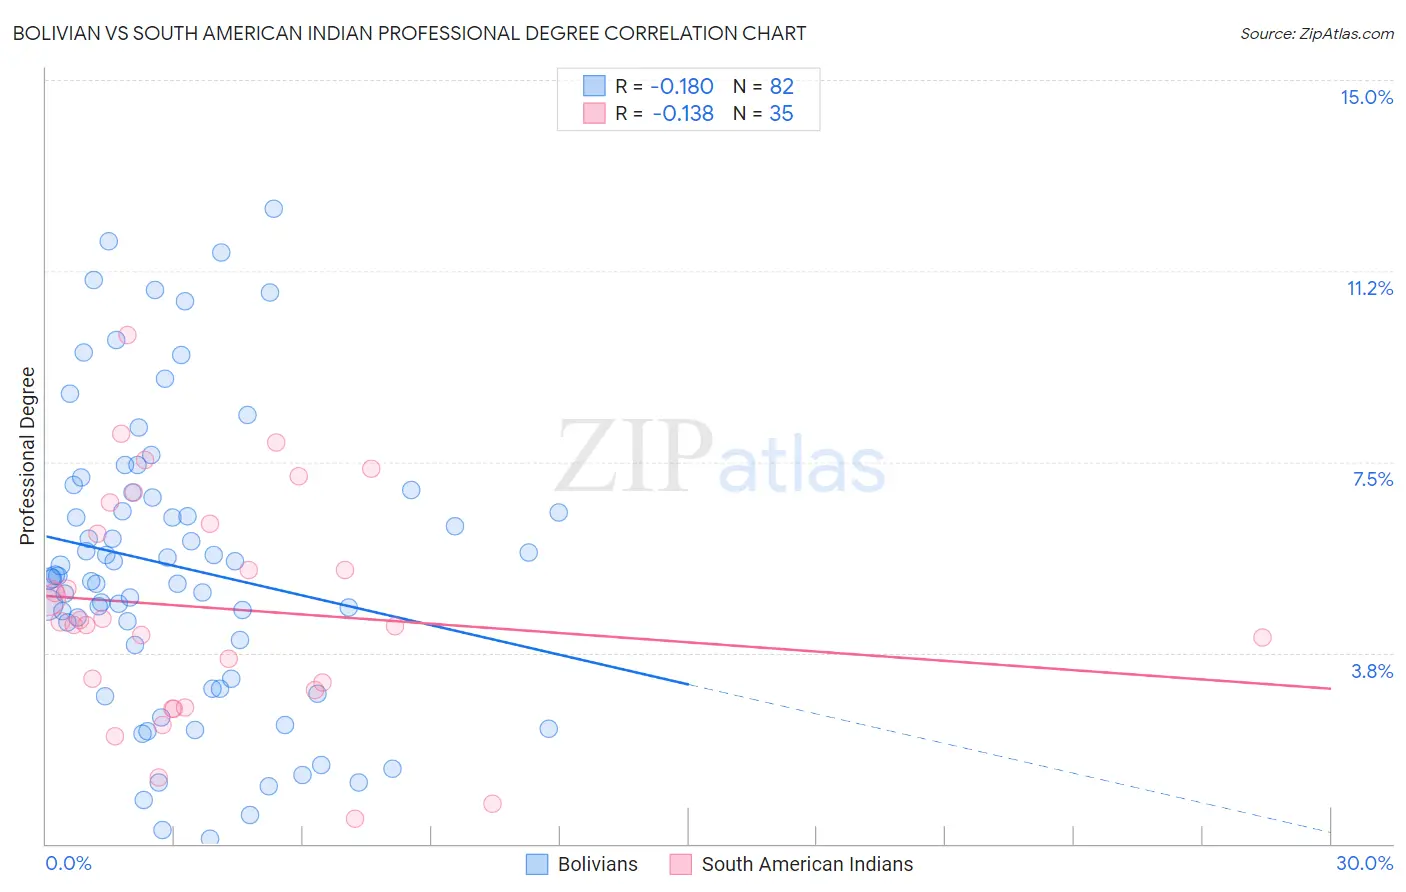
Bolivian vs South American Indian Professional Degree Correlation Chart
The statistical analysis conducted on geographies consisting of 184,548,314 people shows a poor negative correlation between the proportion of Bolivians and percentage of population with at least professional degree education in the United States with a correlation coefficient (R) of -0.180 and weighted average of 5.6%. Similarly, the statistical analysis conducted on geographies consisting of 164,487,198 people shows a poor negative correlation between the proportion of South American Indians and percentage of population with at least professional degree education in the United States with a correlation coefficient (R) of -0.138 and weighted average of 4.8%, a difference of 18.0%.
Professional Degree Correlation Summary
| Measurement | Bolivian | South American Indian |
| Minimum | 0.095% | 0.48% |
| Maximum | 12.5% | 10.0% |
| Range | 12.4% | 9.5% |
| Mean | 5.4% | 4.6% |
| Median | 5.2% | 4.4% |
| Interquartile 25% (IQ1) | 3.2% | 3.0% |
| Interquartile 75% (IQ3) | 6.9% | 6.3% |
| Interquartile Range (IQR) | 3.7% | 3.3% |
| Standard Deviation (Sample) | 2.9% | 2.2% |
| Standard Deviation (Population) | 2.9% | 2.2% |
Similar Demographics by Professional Degree
Demographics Similar to Bolivians by Professional Degree
In terms of professional degree, the demographic groups most similar to Bolivians are Immigrants from Europe (5.6%, a difference of 0.42%), Immigrants from Lithuania (5.6%, a difference of 0.65%), Bulgarian (5.7%, a difference of 0.94%), Immigrants from Belarus (5.5%, a difference of 1.4%), and South African (5.7%, a difference of 1.5%).
| Demographics | Rating | Rank | Professional Degree |
| Immigrants | Netherlands | 100.0 /100 | #53 | Exceptional 5.8% |
| Immigrants | Kuwait | 100.0 /100 | #54 | Exceptional 5.7% |
| Immigrants | Western Europe | 100.0 /100 | #55 | Exceptional 5.7% |
| Immigrants | Malaysia | 100.0 /100 | #56 | Exceptional 5.7% |
| South Africans | 100.0 /100 | #57 | Exceptional 5.7% |
| Bulgarians | 100.0 /100 | #58 | Exceptional 5.7% |
| Immigrants | Europe | 100.0 /100 | #59 | Exceptional 5.6% |
| Bolivians | 99.9 /100 | #60 | Exceptional 5.6% |
| Immigrants | Lithuania | 99.9 /100 | #61 | Exceptional 5.6% |
| Immigrants | Belarus | 99.9 /100 | #62 | Exceptional 5.5% |
| Asians | 99.9 /100 | #63 | Exceptional 5.5% |
| Immigrants | Asia | 99.9 /100 | #64 | Exceptional 5.5% |
| Immigrants | Bolivia | 99.9 /100 | #65 | Exceptional 5.5% |
| Immigrants | Kazakhstan | 99.9 /100 | #66 | Exceptional 5.5% |
| Immigrants | Bulgaria | 99.9 /100 | #67 | Exceptional 5.5% |
Demographics Similar to South American Indians by Professional Degree
In terms of professional degree, the demographic groups most similar to South American Indians are Macedonian (4.8%, a difference of 0.040%), Italian (4.8%, a difference of 0.12%), Immigrants from Jordan (4.7%, a difference of 0.31%), Jordanian (4.7%, a difference of 0.34%), and Pakistani (4.8%, a difference of 0.38%).
| Demographics | Rating | Rank | Professional Degree |
| Serbians | 92.6 /100 | #127 | Exceptional 4.8% |
| Immigrants | Eastern Africa | 92.5 /100 | #128 | Exceptional 4.8% |
| Palestinians | 91.5 /100 | #129 | Exceptional 4.8% |
| Icelanders | 91.5 /100 | #130 | Exceptional 4.8% |
| Immigrants | Nepal | 91.4 /100 | #131 | Exceptional 4.8% |
| Pakistanis | 90.9 /100 | #132 | Exceptional 4.8% |
| Italians | 90.2 /100 | #133 | Exceptional 4.8% |
| South American Indians | 89.9 /100 | #134 | Excellent 4.8% |
| Macedonians | 89.8 /100 | #135 | Excellent 4.8% |
| Immigrants | Jordan | 89.0 /100 | #136 | Excellent 4.7% |
| Jordanians | 88.9 /100 | #137 | Excellent 4.7% |
| Afghans | 88.8 /100 | #138 | Excellent 4.7% |
| South Americans | 85.6 /100 | #139 | Excellent 4.7% |
| Canadians | 84.4 /100 | #140 | Excellent 4.7% |
| Basques | 81.8 /100 | #141 | Excellent 4.6% |