Tlingit-Haida vs Immigrants from China High School Diploma
COMPARE
Tlingit-Haida
Immigrants from China
High School Diploma
High School Diploma Comparison
Tlingit-Haida
Immigrants from China
91.4%
HIGH SCHOOL DIPLOMA
99.9/ 100
METRIC RATING
28th/ 347
METRIC RANK
89.3%
HIGH SCHOOL DIPLOMA
62.0/ 100
METRIC RATING
159th/ 347
METRIC RANK
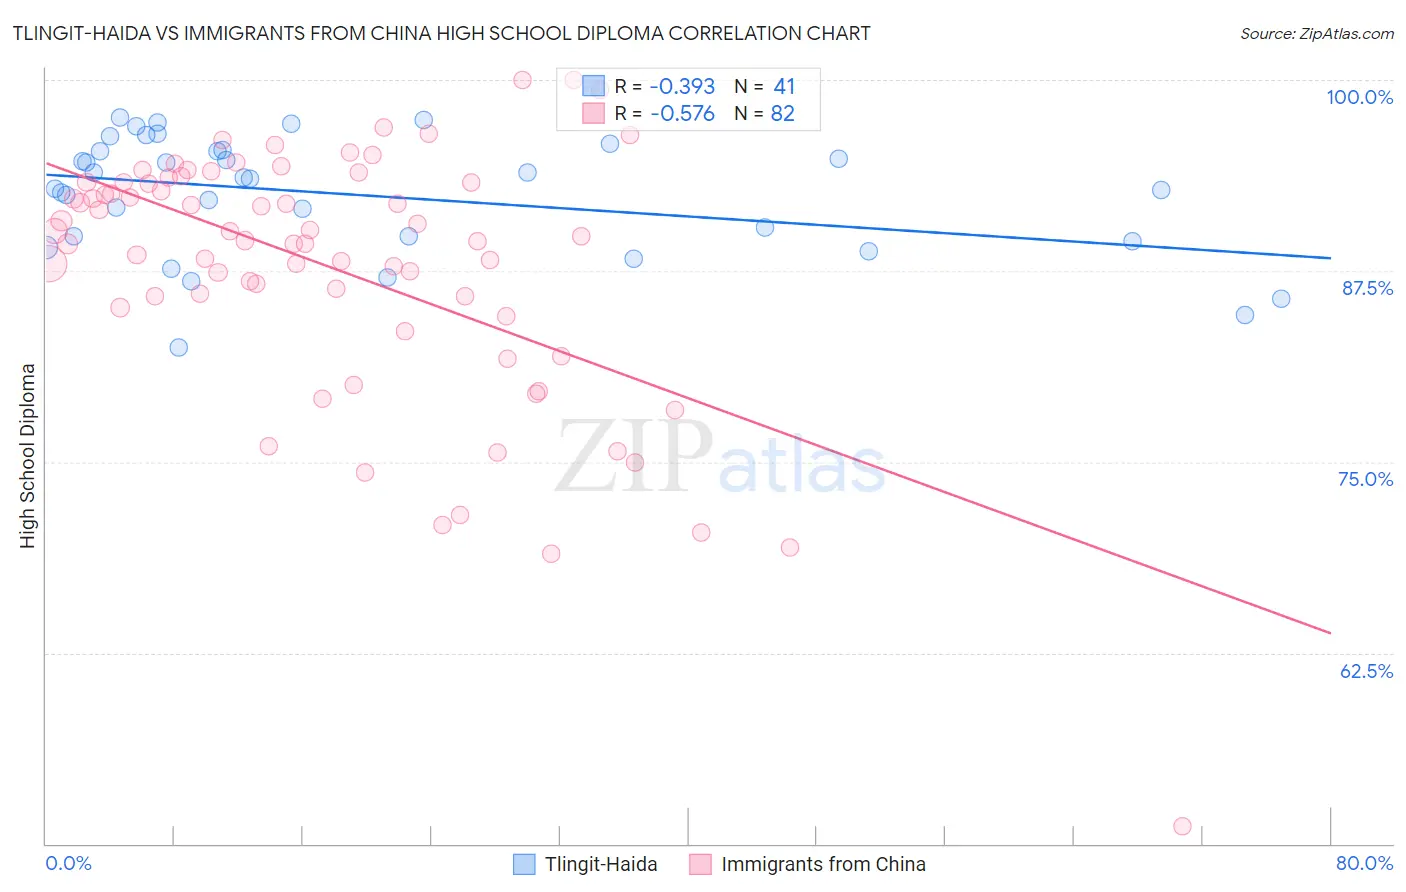
Tlingit-Haida vs Immigrants from China High School Diploma Correlation Chart
The statistical analysis conducted on geographies consisting of 60,871,919 people shows a mild negative correlation between the proportion of Tlingit-Haida and percentage of population with at least high school diploma education in the United States with a correlation coefficient (R) of -0.393 and weighted average of 91.4%. Similarly, the statistical analysis conducted on geographies consisting of 457,082,738 people shows a substantial negative correlation between the proportion of Immigrants from China and percentage of population with at least high school diploma education in the United States with a correlation coefficient (R) of -0.576 and weighted average of 89.3%, a difference of 2.4%.
High School Diploma Correlation Summary
| Measurement | Tlingit-Haida | Immigrants from China |
| Minimum | 82.5% | 51.2% |
| Maximum | 97.5% | 100.0% |
| Range | 15.0% | 48.8% |
| Mean | 92.5% | 87.6% |
| Median | 93.5% | 89.6% |
| Interquartile 25% (IQ1) | 89.6% | 85.1% |
| Interquartile 75% (IQ3) | 95.4% | 93.3% |
| Interquartile Range (IQR) | 5.8% | 8.2% |
| Standard Deviation (Sample) | 3.9% | 8.5% |
| Standard Deviation (Population) | 3.8% | 8.4% |
Similar Demographics by High School Diploma
Demographics Similar to Tlingit-Haida by High School Diploma
In terms of high school diploma, the demographic groups most similar to Tlingit-Haida are European (91.4%, a difference of 0.020%), Cypriot (91.5%, a difference of 0.030%), Iranian (91.4%, a difference of 0.030%), Immigrants from Northern Europe (91.4%, a difference of 0.030%), and English (91.4%, a difference of 0.040%).
| Demographics | Rating | Rank | High School Diploma |
| Filipinos | 99.9 /100 | #21 | Exceptional 91.6% |
| Estonians | 99.9 /100 | #22 | Exceptional 91.6% |
| Scandinavians | 99.9 /100 | #23 | Exceptional 91.5% |
| Italians | 99.9 /100 | #24 | Exceptional 91.5% |
| Thais | 99.9 /100 | #25 | Exceptional 91.5% |
| Russians | 99.9 /100 | #26 | Exceptional 91.5% |
| Cypriots | 99.9 /100 | #27 | Exceptional 91.5% |
| Tlingit-Haida | 99.9 /100 | #28 | Exceptional 91.4% |
| Europeans | 99.9 /100 | #29 | Exceptional 91.4% |
| Iranians | 99.9 /100 | #30 | Exceptional 91.4% |
| Immigrants | Northern Europe | 99.9 /100 | #31 | Exceptional 91.4% |
| English | 99.9 /100 | #32 | Exceptional 91.4% |
| Okinawans | 99.9 /100 | #33 | Exceptional 91.4% |
| Scottish | 99.9 /100 | #34 | Exceptional 91.4% |
| Irish | 99.9 /100 | #35 | Exceptional 91.4% |
Demographics Similar to Immigrants from China by High School Diploma
In terms of high school diploma, the demographic groups most similar to Immigrants from China are Laotian (89.3%, a difference of 0.0%), Immigrants from Pakistan (89.3%, a difference of 0.010%), Brazilian (89.3%, a difference of 0.010%), Bermudan (89.3%, a difference of 0.010%), and Cree (89.3%, a difference of 0.010%).
| Demographics | Rating | Rank | High School Diploma |
| Asians | 70.7 /100 | #152 | Good 89.4% |
| Immigrants | Iraq | 68.7 /100 | #153 | Good 89.4% |
| Alsatians | 66.8 /100 | #154 | Good 89.4% |
| Immigrants | Northern Africa | 66.4 /100 | #155 | Good 89.4% |
| Immigrants | Argentina | 65.5 /100 | #156 | Good 89.4% |
| Immigrants | Malaysia | 63.5 /100 | #157 | Good 89.3% |
| Immigrants | Pakistan | 62.5 /100 | #158 | Good 89.3% |
| Immigrants | China | 62.0 /100 | #159 | Good 89.3% |
| Laotians | 61.8 /100 | #160 | Good 89.3% |
| Brazilians | 61.2 /100 | #161 | Good 89.3% |
| Bermudans | 61.1 /100 | #162 | Good 89.3% |
| Cree | 61.1 /100 | #163 | Good 89.3% |
| Immigrants | Nepal | 61.1 /100 | #164 | Good 89.3% |
| Immigrants | Asia | 59.8 /100 | #165 | Average 89.3% |
| Immigrants | Albania | 59.4 /100 | #166 | Average 89.3% |