Jordanian vs Immigrants from China High School Diploma

COMPARE

Jordanian
Race
Ancestry
AfghanAfricanAlaska NativeAlaskan AthabascanAlbanianAleutAlsatianAmericanApacheArabArapahoArgentineanArmenianAssyrian/Chaldean/SyriacAustralianAustrianBahamianBangladeshiBarbadianBasqueBelgianBelizeanBermudanBhutaneseBlackfeetBolivianBrazilianBritishBritish West IndianBulgarianBurmeseCajunCambodianCanadianCape VerdeanCarpatho RusynCelticCentral AmericanCentral American IndianCherokeeCheyenneChickasawChileanChineseChippewaChoctawColombianColvilleComancheCosta RicanCreeCreekCroatianCrowCubanCypriotCzechCzechoslovakianDanishDelawareDominicanDutchDutch West IndianEastern EuropeanEcuadorianEgyptianEnglishEstonianEthiopianEuropeanFijianFilipinoFinnishFrenchFrench American IndianFrench CanadianGermanGerman RussianGhanaianGreekGuamanian/ChamorroGuatemalanGuyaneseHaitianHmongHonduranHopiHoumaHungarianIcelanderIndian (Asian)IndonesianInupiatIranianIraqiIrishIroquoisIsraeliItalianJamaicanJapaneseJordanianKenyanKiowaKoreanLaotianLatvianLebaneseLiberianLithuanianLumbeeLuxembourgerMacedonianMalaysianMalteseMarshalleseMenomineeMexicanMexican American IndianMongolianMoroccanNative HawaiianNavajoNepaleseNew ZealanderNicaraguanNigerianNorthern EuropeanNorwegianOkinawanOsageOttawaPaiutePakistaniPalestinianPanamanianParaguayanPennsylvania GermanPeruvianPimaPolishPortuguesePotawatomiPuebloPuerto RicanPuget Sound SalishRomanianRussianSalvadoranSamoanScandinavianScotch-IrishScottishSeminoleSenegaleseSerbianShoshoneSierra LeoneanSiouxSlavicSlovakSloveneSomaliSouth AfricanSouth AmericanSouth American IndianSoviet UnionSpaniardSpanishSpanish AmericanSpanish American IndianSri LankanSubsaharan AfricanSudaneseSwedishSwissSyrianTaiwaneseThaiTlingit-HaidaTohono O'OdhamTonganTrinidadian and TobagonianTsimshianTurkishU.S. Virgin IslanderUgandanUkrainianUruguayanUteVenezuelanVietnameseWelshWest IndianYakamaYaquiYugoslavianYumanYup'ikZimbabwean
Immigration
NonimmigrantsImmigrantsAfghanistanAfricaAlbaniaArgentinaArmeniaAsiaAustraliaAustriaBahamasBangladeshBarbadosBelarusBelgiumBelizeBoliviaBosnia and HerzegovinaBrazilBulgariaBurma/MyanmarCabo VerdeCambodiaCameroonCanadaCaribbeanCentral AmericaChileColombiaCongoCosta RicaCroatiaCubaCzechoslovakiaDenmarkDominicaDominican RepublicEastern AfricaEastern AsiaEastern EuropeEcuadorEgyptEl SalvadorEnglandEritreaEthiopiaEuropeFijiFranceGermanyGhanaGreeceGrenadaGuatemalaGuyanaHaitiHondurasHong KongHungaryIndiaIndonesiaIranIraqIrelandIsraelItalyJamaicaJapanJordanKazakhstanKenyaKoreaKuwaitLaosLatin AmericaLatviaLebanonLiberiaLithuaniaMalaysiaMexicoMicronesiaMiddle AfricaMoldovaMoroccoNepalNetherlandsNicaraguaNigeriaNorth AmericaNorth MacedoniaNorthern AfricaNorthern EuropeNorwayOceaniaPakistanPanamaPeruPhilippinesPolandPortugalRomaniaRussiaSaudi ArabiaScotlandSenegalSerbiaSierra LeoneSingaporeSomaliaSouth AfricaSouth AmericaSouth Central AsiaSouth Eastern AsiaSouthern EuropeSpainSri LankaSt. Vincent and the GrenadinesSudanSwedenSwitzerlandSyriaTaiwanThailandTrinidad and TobagoTurkeyUgandaUkraineUruguayUzbekistanVenezuelaVietnamWest IndiesWestern AfricaWestern AsiaWestern EuropeYemenZaireZimbabweAzores
Immigrants from China
Race
Ancestry
AfghanAfricanAlaska NativeAlaskan AthabascanAlbanianAleutAlsatianAmericanApacheArabArapahoArgentineanArmenianAssyrian/Chaldean/SyriacAustralianAustrianBahamianBangladeshiBarbadianBasqueBelgianBelizeanBermudanBhutaneseBlackfeetBolivianBrazilianBritishBritish West IndianBulgarianBurmeseCajunCambodianCanadianCape VerdeanCarpatho RusynCelticCentral AmericanCentral American IndianCherokeeCheyenneChickasawChileanChineseChippewaChoctawColombianColvilleComancheCosta RicanCreeCreekCroatianCrowCubanCypriotCzechCzechoslovakianDanishDelawareDominicanDutchDutch West IndianEastern EuropeanEcuadorianEgyptianEnglishEstonianEthiopianEuropeanFijianFilipinoFinnishFrenchFrench American IndianFrench CanadianGermanGerman RussianGhanaianGreekGuamanian/ChamorroGuatemalanGuyaneseHaitianHmongHonduranHopiHoumaHungarianIcelanderIndian (Asian)IndonesianInupiatIranianIraqiIrishIroquoisIsraeliItalianJamaicanJapaneseKenyanKiowaKoreanLaotianLatvianLebaneseLiberianLithuanianLumbeeLuxembourgerMacedonianMalaysianMalteseMarshalleseMenomineeMexicanMexican American IndianMongolianMoroccanNative HawaiianNavajoNepaleseNew ZealanderNicaraguanNigerianNorthern EuropeanNorwegianOkinawanOsageOttawaPaiutePakistaniPalestinianPanamanianParaguayanPennsylvania GermanPeruvianPimaPolishPortuguesePotawatomiPuebloPuerto RicanPuget Sound SalishRomanianRussianSalvadoranSamoanScandinavianScotch-IrishScottishSeminoleSenegaleseSerbianShoshoneSierra LeoneanSiouxSlavicSlovakSloveneSomaliSouth AfricanSouth AmericanSouth American IndianSoviet UnionSpaniardSpanishSpanish AmericanSpanish American IndianSri LankanSubsaharan AfricanSudaneseSwedishSwissSyrianTaiwaneseThaiTlingit-HaidaTohono O'OdhamTonganTrinidadian and TobagonianTsimshianTurkishU.S. Virgin IslanderUgandanUkrainianUruguayanUteVenezuelanVietnameseWelshWest IndianYakamaYaquiYugoslavianYumanYup'ikZimbabwean
Immigration
NonimmigrantsImmigrantsAfghanistanAfricaAlbaniaArgentinaArmeniaAsiaAustraliaAustriaBahamasBangladeshBarbadosBelarusBelgiumBelizeBoliviaBosnia and HerzegovinaBrazilBulgariaBurma/MyanmarCabo VerdeCambodiaCameroonCanadaCaribbeanCentral AmericaChileChinaColombiaCongoCosta RicaCroatiaCubaCzechoslovakiaDenmarkDominicaDominican RepublicEastern AfricaEastern AsiaEastern EuropeEcuadorEgyptEl SalvadorEnglandEritreaEthiopiaEuropeFijiFranceGermanyGhanaGreeceGrenadaGuatemalaGuyanaHaitiHondurasHong KongHungaryIndiaIndonesiaIranIraqIrelandIsraelItalyJamaicaJapanJordanKazakhstanKenyaKoreaKuwaitLaosLatin AmericaLatviaLebanonLiberiaLithuaniaMalaysiaMexicoMicronesiaMiddle AfricaMoldovaMoroccoNepalNetherlandsNicaraguaNigeriaNorth AmericaNorth MacedoniaNorthern AfricaNorthern EuropeNorwayOceaniaPakistanPanamaPeruPhilippinesPolandPortugalRomaniaRussiaSaudi ArabiaScotlandSenegalSerbiaSierra LeoneSingaporeSomaliaSouth AfricaSouth AmericaSouth Central AsiaSouth Eastern AsiaSouthern EuropeSpainSri LankaSt. Vincent and the GrenadinesSudanSwedenSwitzerlandSyriaTaiwanThailandTrinidad and TobagoTurkeyUgandaUkraineUruguayUzbekistanVenezuelaVietnamWest IndiesWestern AfricaWestern AsiaWestern EuropeYemenZaireZimbabweAzores
High School Diploma
Income
Poverty
Unemployment
Labor Participation
Family Structure
Vehicle Availability
Education Level
Disability

High School Diploma Comparison

Jordanians

Immigrants from China

Exceptional
Good
90.2%
HIGH SCHOOL DIPLOMA
95.4/ 100
METRIC RATING
117th/ 347
METRIC RANK
89.3%
HIGH SCHOOL DIPLOMA
62.0/ 100
METRIC RATING
159th/ 347
METRIC RANK

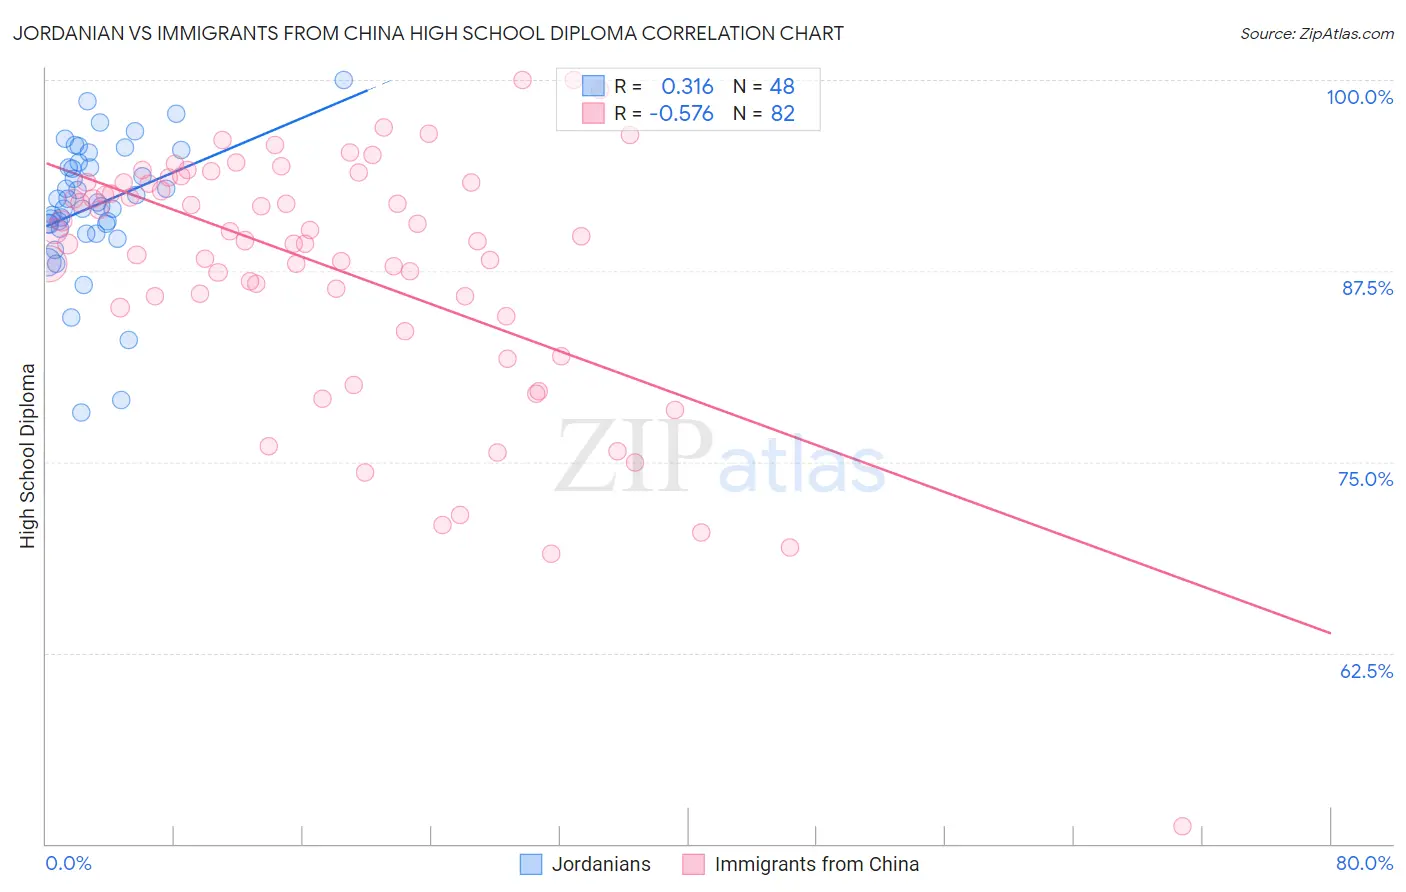
Jordanian vs Immigrants from China High School Diploma Correlation Chart

The statistical analysis conducted on geographies consisting of 166,423,935 people shows a mild positive correlation between the proportion of Jordanians and percentage of population with at least high school diploma education in the United States with a correlation coefficient (R) of 0.316 and weighted average of 90.2%. Similarly, the statistical analysis conducted on geographies consisting of 457,082,738 people shows a substantial negative correlation between the proportion of Immigrants from China and percentage of population with at least high school diploma education in the United States with a correlation coefficient (R) of -0.576 and weighted average of 89.3%, a difference of 0.96%.
Jordanian vs Immigrants from China High School Diploma

High School Diploma Correlation Summary

MeasurementJordanianImmigrants from China
Minimum78.2%51.2%
Maximum100.0%100.0%
Range21.8%48.8%
Mean91.8%87.6%
Median91.9%89.6%
Interquartile 25% (IQ1)90.4%85.1%
Interquartile 75% (IQ3)94.5%93.3%
Interquartile Range (IQR)4.1%8.2%
Standard Deviation (Sample)4.4%8.5%
Standard Deviation (Population)4.3%8.4%

Similar Demographics by High School Diploma

Demographics Similar to Jordanians by High School Diploma

In terms of high school diploma, the demographic groups most similar to Jordanians are Israeli (90.1%, a difference of 0.020%), Immigrants from Germany (90.2%, a difference of 0.030%), Immigrants from Hungary (90.2%, a difference of 0.040%), Immigrants from Eastern Europe (90.1%, a difference of 0.040%), and Ottawa (90.1%, a difference of 0.070%).
DemographicsRating | RankHigh School Diploma
Immigrants | Greece
96.6
/100
|
#110
Exceptional
90.3%
Menominee
96.6
/100
|
#111
Exceptional
90.3%
Immigrants | Belarus
96.4
/100
|
#112
Exceptional
90.2%
Immigrants | Sri Lanka
96.3
/100
|
#113
Exceptional
90.2%
Yugoslavians
96.2
/100
|
#114
Exceptional
90.2%
Immigrants | Hungary
95.8
/100
|
#115
Exceptional
90.2%
Immigrants | Germany
95.7
/100
|
#116
Exceptional
90.2%
Jordanians
95.4
/100
|
#117
Exceptional
90.2%
Israelis
95.1
/100
|
#118
Exceptional
90.1%
Immigrants | Eastern Europe
94.9
/100
|
#119
Exceptional
90.1%
Ottawa
94.4
/100
|
#120
Exceptional
90.1%
Whites/Caucasians
94.1
/100
|
#121
Exceptional
90.1%
Immigrants | Kazakhstan
93.4
/100
|
#122
Exceptional
90.0%
German Russians
92.0
/100
|
#123
Exceptional
90.0%
Mongolians
91.6
/100
|
#124
Exceptional
89.9%

Demographics Similar to Immigrants from China by High School Diploma

In terms of high school diploma, the demographic groups most similar to Immigrants from China are Laotian (89.3%, a difference of 0.0%), Immigrants from Pakistan (89.3%, a difference of 0.010%), Brazilian (89.3%, a difference of 0.010%), Bermudan (89.3%, a difference of 0.010%), and Cree (89.3%, a difference of 0.010%).
DemographicsRating | RankHigh School Diploma
Asians
70.7
/100
|
#152
Good
89.4%
Immigrants | Iraq
68.7
/100
|
#153
Good
89.4%
Alsatians
66.8
/100
|
#154
Good
89.4%
Immigrants | Northern Africa
66.4
/100
|
#155
Good
89.4%
Immigrants | Argentina
65.5
/100
|
#156
Good
89.4%
Immigrants | Malaysia
63.5
/100
|
#157
Good
89.3%
Immigrants | Pakistan
62.5
/100
|
#158
Good
89.3%
Immigrants | China
62.0
/100
|
#159
Good
89.3%
Laotians
61.8
/100
|
#160
Good
89.3%
Brazilians
61.2
/100
|
#161
Good
89.3%
Bermudans
61.1
/100
|
#162
Good
89.3%
Cree
61.1
/100
|
#163
Good
89.3%
Immigrants | Nepal
61.1
/100
|
#164
Good
89.3%
Immigrants | Asia
59.8
/100
|
#165
Average
89.3%
Immigrants | Albania
59.4
/100
|
#166
Average
89.3%