Tlingit-Haida vs Immigrants from China 12th Grade, No Diploma

COMPARE

Tlingit-Haida
Race
Ancestry
AfghanAfricanAlaska NativeAlaskan AthabascanAlbanianAleutAlsatianAmericanApacheArabArapahoArgentineanArmenianAssyrian/Chaldean/SyriacAustralianAustrianBahamianBangladeshiBarbadianBasqueBelgianBelizeanBermudanBhutaneseBlackfeetBolivianBrazilianBritishBritish West IndianBulgarianBurmeseCajunCambodianCanadianCape VerdeanCarpatho RusynCelticCentral AmericanCentral American IndianCherokeeCheyenneChickasawChileanChineseChippewaChoctawColombianColvilleComancheCosta RicanCreeCreekCroatianCrowCubanCypriotCzechCzechoslovakianDanishDelawareDominicanDutchDutch West IndianEastern EuropeanEcuadorianEgyptianEnglishEstonianEthiopianEuropeanFijianFilipinoFinnishFrenchFrench American IndianFrench CanadianGermanGerman RussianGhanaianGreekGuamanian/ChamorroGuatemalanGuyaneseHaitianHmongHonduranHopiHoumaHungarianIcelanderIndian (Asian)IndonesianInupiatIranianIraqiIrishIroquoisIsraeliItalianJamaicanJapaneseJordanianKenyanKiowaKoreanLaotianLatvianLebaneseLiberianLithuanianLumbeeLuxembourgerMacedonianMalaysianMalteseMarshalleseMenomineeMexicanMexican American IndianMongolianMoroccanNative HawaiianNavajoNepaleseNew ZealanderNicaraguanNigerianNorthern EuropeanNorwegianOkinawanOsageOttawaPaiutePakistaniPalestinianPanamanianParaguayanPennsylvania GermanPeruvianPimaPolishPortuguesePotawatomiPuebloPuerto RicanPuget Sound SalishRomanianRussianSalvadoranSamoanScandinavianScotch-IrishScottishSeminoleSenegaleseSerbianShoshoneSierra LeoneanSiouxSlavicSlovakSloveneSomaliSouth AfricanSouth AmericanSouth American IndianSoviet UnionSpaniardSpanishSpanish AmericanSpanish American IndianSri LankanSubsaharan AfricanSudaneseSwedishSwissSyrianTaiwaneseThaiTlingit-HaidaTohono O'OdhamTonganTrinidadian and TobagonianTsimshianTurkishU.S. Virgin IslanderUgandanUkrainianUruguayanUteVenezuelanVietnameseWelshWest IndianYakamaYaquiYugoslavianYumanYup'ikZimbabwean
Immigration
NonimmigrantsImmigrantsAfghanistanAfricaAlbaniaArgentinaArmeniaAsiaAustraliaAustriaBahamasBangladeshBarbadosBelarusBelgiumBelizeBoliviaBosnia and HerzegovinaBrazilBulgariaBurma/MyanmarCabo VerdeCambodiaCameroonCanadaCaribbeanCentral AmericaChileColombiaCongoCosta RicaCroatiaCubaCzechoslovakiaDenmarkDominicaDominican RepublicEastern AfricaEastern AsiaEastern EuropeEcuadorEgyptEl SalvadorEnglandEritreaEthiopiaEuropeFijiFranceGermanyGhanaGreeceGrenadaGuatemalaGuyanaHaitiHondurasHong KongHungaryIndiaIndonesiaIranIraqIrelandIsraelItalyJamaicaJapanJordanKazakhstanKenyaKoreaKuwaitLaosLatin AmericaLatviaLebanonLiberiaLithuaniaMalaysiaMexicoMicronesiaMiddle AfricaMoldovaMoroccoNepalNetherlandsNicaraguaNigeriaNorth AmericaNorth MacedoniaNorthern AfricaNorthern EuropeNorwayOceaniaPakistanPanamaPeruPhilippinesPolandPortugalRomaniaRussiaSaudi ArabiaScotlandSenegalSerbiaSierra LeoneSingaporeSomaliaSouth AfricaSouth AmericaSouth Central AsiaSouth Eastern AsiaSouthern EuropeSpainSri LankaSt. Vincent and the GrenadinesSudanSwedenSwitzerlandSyriaTaiwanThailandTrinidad and TobagoTurkeyUgandaUkraineUruguayUzbekistanVenezuelaVietnamWest IndiesWestern AfricaWestern AsiaWestern EuropeYemenZaireZimbabweAzores
Immigrants from China
Race
Ancestry
AfghanAfricanAlaska NativeAlaskan AthabascanAlbanianAleutAlsatianAmericanApacheArabArapahoArgentineanArmenianAssyrian/Chaldean/SyriacAustralianAustrianBahamianBangladeshiBarbadianBasqueBelgianBelizeanBermudanBhutaneseBlackfeetBolivianBrazilianBritishBritish West IndianBulgarianBurmeseCajunCambodianCanadianCape VerdeanCarpatho RusynCelticCentral AmericanCentral American IndianCherokeeCheyenneChickasawChileanChineseChippewaChoctawColombianColvilleComancheCosta RicanCreeCreekCroatianCrowCubanCypriotCzechCzechoslovakianDanishDelawareDominicanDutchDutch West IndianEastern EuropeanEcuadorianEgyptianEnglishEstonianEthiopianEuropeanFijianFilipinoFinnishFrenchFrench American IndianFrench CanadianGermanGerman RussianGhanaianGreekGuamanian/ChamorroGuatemalanGuyaneseHaitianHmongHonduranHopiHoumaHungarianIcelanderIndian (Asian)IndonesianInupiatIranianIraqiIrishIroquoisIsraeliItalianJamaicanJapaneseJordanianKenyanKiowaKoreanLaotianLatvianLebaneseLiberianLithuanianLumbeeLuxembourgerMacedonianMalaysianMalteseMarshalleseMenomineeMexicanMexican American IndianMongolianMoroccanNative HawaiianNavajoNepaleseNew ZealanderNicaraguanNigerianNorthern EuropeanNorwegianOkinawanOsageOttawaPaiutePakistaniPalestinianPanamanianParaguayanPennsylvania GermanPeruvianPimaPolishPortuguesePotawatomiPuebloPuerto RicanPuget Sound SalishRomanianRussianSalvadoranSamoanScandinavianScotch-IrishScottishSeminoleSenegaleseSerbianShoshoneSierra LeoneanSiouxSlavicSlovakSloveneSomaliSouth AfricanSouth AmericanSouth American IndianSoviet UnionSpaniardSpanishSpanish AmericanSpanish American IndianSri LankanSubsaharan AfricanSudaneseSwedishSwissSyrianTaiwaneseThaiTohono O'OdhamTonganTrinidadian and TobagonianTsimshianTurkishU.S. Virgin IslanderUgandanUkrainianUruguayanUteVenezuelanVietnameseWelshWest IndianYakamaYaquiYugoslavianYumanYup'ikZimbabwean
Immigration
NonimmigrantsImmigrantsAfghanistanAfricaAlbaniaArgentinaArmeniaAsiaAustraliaAustriaBahamasBangladeshBarbadosBelarusBelgiumBelizeBoliviaBosnia and HerzegovinaBrazilBulgariaBurma/MyanmarCabo VerdeCambodiaCameroonCanadaCaribbeanCentral AmericaChileChinaColombiaCongoCosta RicaCroatiaCubaCzechoslovakiaDenmarkDominicaDominican RepublicEastern AfricaEastern AsiaEastern EuropeEcuadorEgyptEl SalvadorEnglandEritreaEthiopiaEuropeFijiFranceGermanyGhanaGreeceGrenadaGuatemalaGuyanaHaitiHondurasHong KongHungaryIndiaIndonesiaIranIraqIrelandIsraelItalyJamaicaJapanJordanKazakhstanKenyaKoreaKuwaitLaosLatin AmericaLatviaLebanonLiberiaLithuaniaMalaysiaMexicoMicronesiaMiddle AfricaMoldovaMoroccoNepalNetherlandsNicaraguaNigeriaNorth AmericaNorth MacedoniaNorthern AfricaNorthern EuropeNorwayOceaniaPakistanPanamaPeruPhilippinesPolandPortugalRomaniaRussiaSaudi ArabiaScotlandSenegalSerbiaSierra LeoneSingaporeSomaliaSouth AfricaSouth AmericaSouth Central AsiaSouth Eastern AsiaSouthern EuropeSpainSri LankaSt. Vincent and the GrenadinesSudanSwedenSwitzerlandSyriaTaiwanThailandTrinidad and TobagoTurkeyUgandaUkraineUruguayUzbekistanVenezuelaVietnamWest IndiesWestern AfricaWestern AsiaWestern EuropeYemenZaireZimbabweAzores
12th Grade, No Diploma
Income
Poverty
Unemployment
Labor Participation
Family Structure
Vehicle Availability
Education Level
Disability

12th Grade, No Diploma Comparison

Tlingit-Haida

Immigrants from China

Exceptional
Good
93.0%
12TH GRADE, NO DIPLOMA
99.8/ 100
METRIC RATING
38th/ 347
METRIC RANK
91.3%
12TH GRADE, NO DIPLOMA
60.9/ 100
METRIC RATING
164th/ 347
METRIC RANK

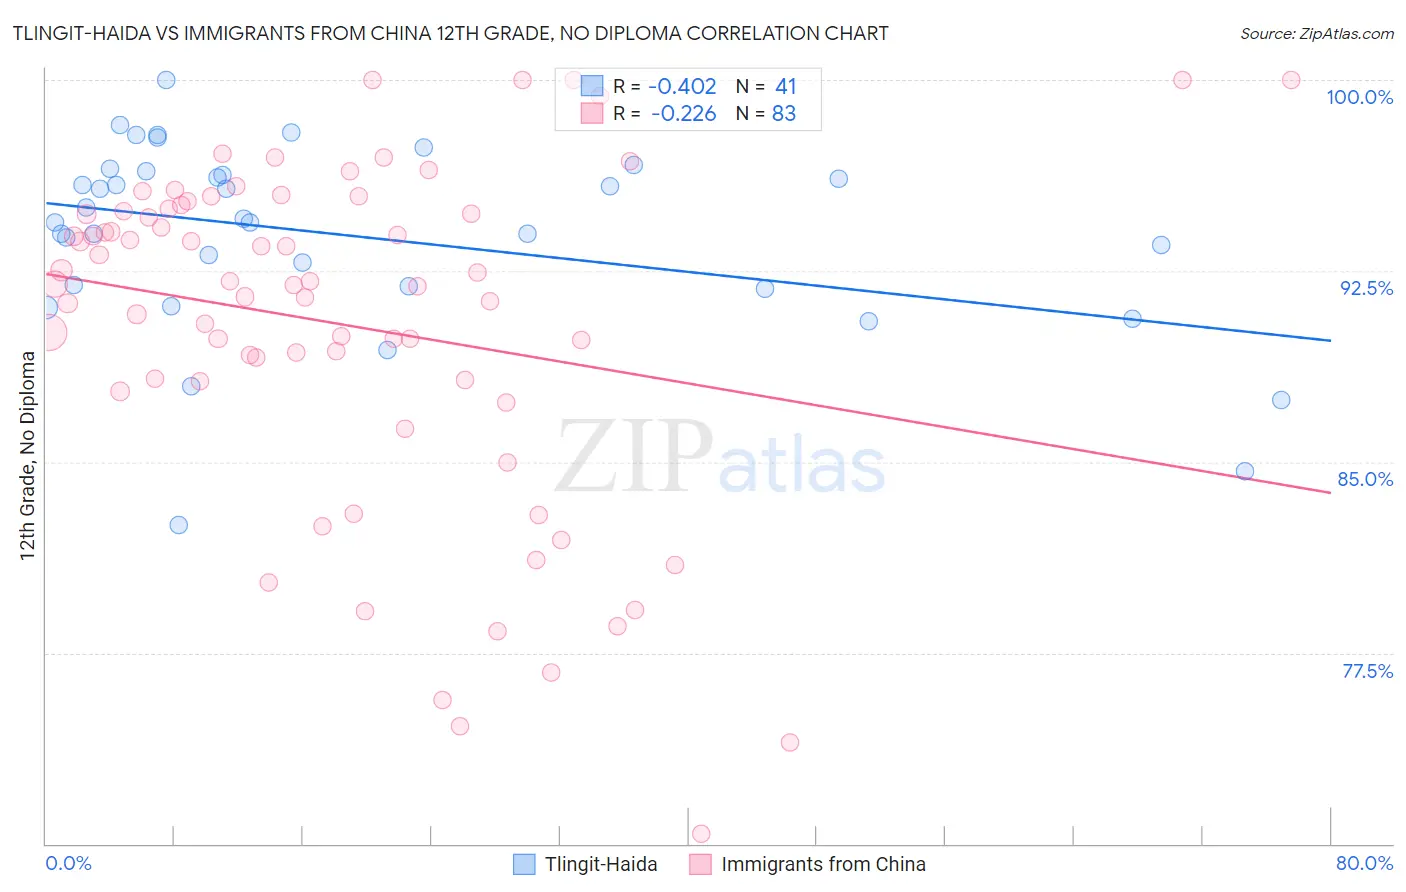
Tlingit-Haida vs Immigrants from China 12th Grade, No Diploma Correlation Chart

The statistical analysis conducted on geographies consisting of 60,871,919 people shows a moderate negative correlation between the proportion of Tlingit-Haida and percentage of population with at least 12th grade (no diploma) education in the United States with a correlation coefficient (R) of -0.402 and weighted average of 93.0%. Similarly, the statistical analysis conducted on geographies consisting of 457,082,916 people shows a weak negative correlation between the proportion of Immigrants from China and percentage of population with at least 12th grade (no diploma) education in the United States with a correlation coefficient (R) of -0.226 and weighted average of 91.3%, a difference of 1.8%.
Tlingit-Haida vs Immigrants from China 12th Grade, No Diploma

12th Grade, No Diploma Correlation Summary

MeasurementTlingit-HaidaImmigrants from China
Minimum82.5%70.4%
Maximum100.0%100.0%
Range17.5%29.6%
Mean93.9%90.4%
Median94.4%92.0%
Interquartile 25% (IQ1)91.8%88.2%
Interquartile 75% (IQ3)96.3%95.0%
Interquartile Range (IQR)4.5%6.8%
Standard Deviation (Sample)3.7%6.7%
Standard Deviation (Population)3.7%6.7%

Similar Demographics by 12th Grade, No Diploma

Demographics Similar to Tlingit-Haida by 12th Grade, No Diploma

In terms of 12th grade, no diploma, the demographic groups most similar to Tlingit-Haida are Immigrants from Austria (93.0%, a difference of 0.010%), Turkish (93.0%, a difference of 0.010%), Bhutanese (93.0%, a difference of 0.010%), Scottish (93.0%, a difference of 0.030%), and Irish (93.0%, a difference of 0.030%).
DemographicsRating | Rank12th Grade, No Diploma
Immigrants | Ireland
99.9
/100
|
#31
Exceptional
93.1%
Europeans
99.9
/100
|
#32
Exceptional
93.1%
Immigrants | Scotland
99.9
/100
|
#33
Exceptional
93.0%
Okinawans
99.9
/100
|
#34
Exceptional
93.0%
English
99.9
/100
|
#35
Exceptional
93.0%
Scottish
99.9
/100
|
#36
Exceptional
93.0%
Irish
99.9
/100
|
#37
Exceptional
93.0%
Tlingit-Haida
99.8
/100
|
#38
Exceptional
93.0%
Immigrants | Austria
99.8
/100
|
#39
Exceptional
93.0%
Turks
99.8
/100
|
#40
Exceptional
93.0%
Bhutanese
99.8
/100
|
#41
Exceptional
93.0%
Immigrants | Australia
99.8
/100
|
#42
Exceptional
92.9%
Northern Europeans
99.8
/100
|
#43
Exceptional
92.9%
Dutch
99.8
/100
|
#44
Exceptional
92.9%
Greeks
99.8
/100
|
#45
Exceptional
92.9%

Demographics Similar to Immigrants from China by 12th Grade, No Diploma

In terms of 12th grade, no diploma, the demographic groups most similar to Immigrants from China are Brazilian (91.3%, a difference of 0.010%), Immigrants from Asia (91.3%, a difference of 0.010%), Alsatian (91.3%, a difference of 0.030%), Immigrants from Albania (91.3%, a difference of 0.040%), and Immigrants from Hong Kong (91.3%, a difference of 0.040%).
DemographicsRating | Rank12th Grade, No Diploma
Immigrants | Pakistan
70.7
/100
|
#157
Good
91.4%
Immigrants | Northern Africa
66.2
/100
|
#158
Good
91.4%
Laotians
64.4
/100
|
#159
Good
91.3%
Immigrants | Albania
64.1
/100
|
#160
Good
91.3%
Immigrants | Hong Kong
63.8
/100
|
#161
Good
91.3%
Brazilians
62.0
/100
|
#162
Good
91.3%
Immigrants | Asia
61.5
/100
|
#163
Good
91.3%
Immigrants | China
60.9
/100
|
#164
Good
91.3%
Alsatians
58.3
/100
|
#165
Average
91.3%
Hmong
58.0
/100
|
#166
Average
91.3%
Immigrants | Malaysia
57.8
/100
|
#167
Average
91.3%
Cree
57.0
/100
|
#168
Average
91.2%
Immigrants | Indonesia
54.9
/100
|
#169
Average
91.2%
Delaware
52.8
/100
|
#170
Average
91.2%
Immigrants | Morocco
51.4
/100
|
#171
Average
91.2%